

In the digital era, where applications and services run around the clock, ensuring their performance and availability becomes crucial. AWS CloudWatch stands as a beacon for developers and operations teams navigating the vast seas of cloud computing, offering them the tools necessary to monitor their AWS resources and applications in real time. In this blog, we'll explore AWS CloudWatch in detail, from its core functionalities to its advantages and disadvantages, and hands-on demo to illustrate its practical application.
What is AWS CloudWatch?
AWS CloudWatch is a monitoring and observability service offered by Amazon Web Services (AWS) designed to provide data and actionable insights to monitor your applications, respond to system-wide performance changes, optimize resource utilization, and get a unified view of operational health. CloudWatch collects monitoring and operational data in the form of logs, metrics, and events, providing you with a detailed view of AWS resources, applications, and services that run on AWS and on-premises servers.
Working
Deep Dive into AWS CloudWatch Mechanics
AWS CloudWatch operates on the principle of observability, enabling you to collect and access all your performance and operational data from a single platform. Here's how it works in a detailed manner:
Metrics Collection: CloudWatch collects metrics from various AWS resources like Amazon EC2 instances, Amazon DynamoDB tables, and Amazon RDS DB instances. Metrics are variables you can monitor, such as CPU usage, disk reads/writes, or network traffic. These metrics are stored and tracked over time, allowing for historical data analysis and real-time monitoring.
Logs Management: CloudWatch Logs enables you to collect, store, and analyze log files from your AWS resources, applications, and on-premises servers. This feature allows for real-time monitoring of logs, searchable log data, and the ability to set alarms or trigger actions based on specific log patterns.
Events Handling: CloudWatch Events (now part of Amazon EventBridge) lets you respond to state changes in your AWS resources. You can set up rules to trigger actions in response to events, such as automatically invoking an AWS Lambda function when an event occurs.
Alarms and Notifications: You can set up alarms in CloudWatch to notify you when specific metrics reach certain thresholds. Alarms can trigger notifications through Amazon SNS or take automatic actions, such as stopping an EC2 instance when it reaches a certain CPU utilization level.
Dashboards: CloudWatch provides customizable dashboards that allow you to create visual representations of your metrics and logs. These dashboards can be used to monitor the health and performance of your AWS resources in real time.
Advantages
Comprehensive Coverage: CloudWatch offers a unified platform to monitor AWS resources, applications, and services, reducing the complexity of using multiple monitoring tools.
Flexibility: With its ability to monitor and log data, CloudWatch provides flexibility in how data is collected, viewed, and used to make informed decisions.
Scalability: As your application or service grows, CloudWatch seamlessly scales with your AWS environment to provide consistent monitoring capabilities.
Customizable Alarms and Notifications: The ability to set custom alarms and automate responses to specific events helps maintain operational health and performance.
Disadvantages
Complexity: For beginners, navigating CloudWatch's extensive features and capabilities can be overwhelming.
Cost: While CloudWatch provides basic monitoring capabilities for free, advanced features and extensive use of metrics, logs, and alarms can lead to higher costs.
Integration with Non-AWS Resources: While CloudWatch supports monitoring of on-premises servers, integration with non-AWS resources can be more challenging compared to AWS resources.
Demo
In the demo, we will launch an EC2 instance and run cpu_spike.py on that server, which will spike the CPU utilization threshold to 80%. Then, we will create an alarm to receive an email notification whenever our threshold exceeds 60%.
Launch an EC2 instance and access it via the CLI.

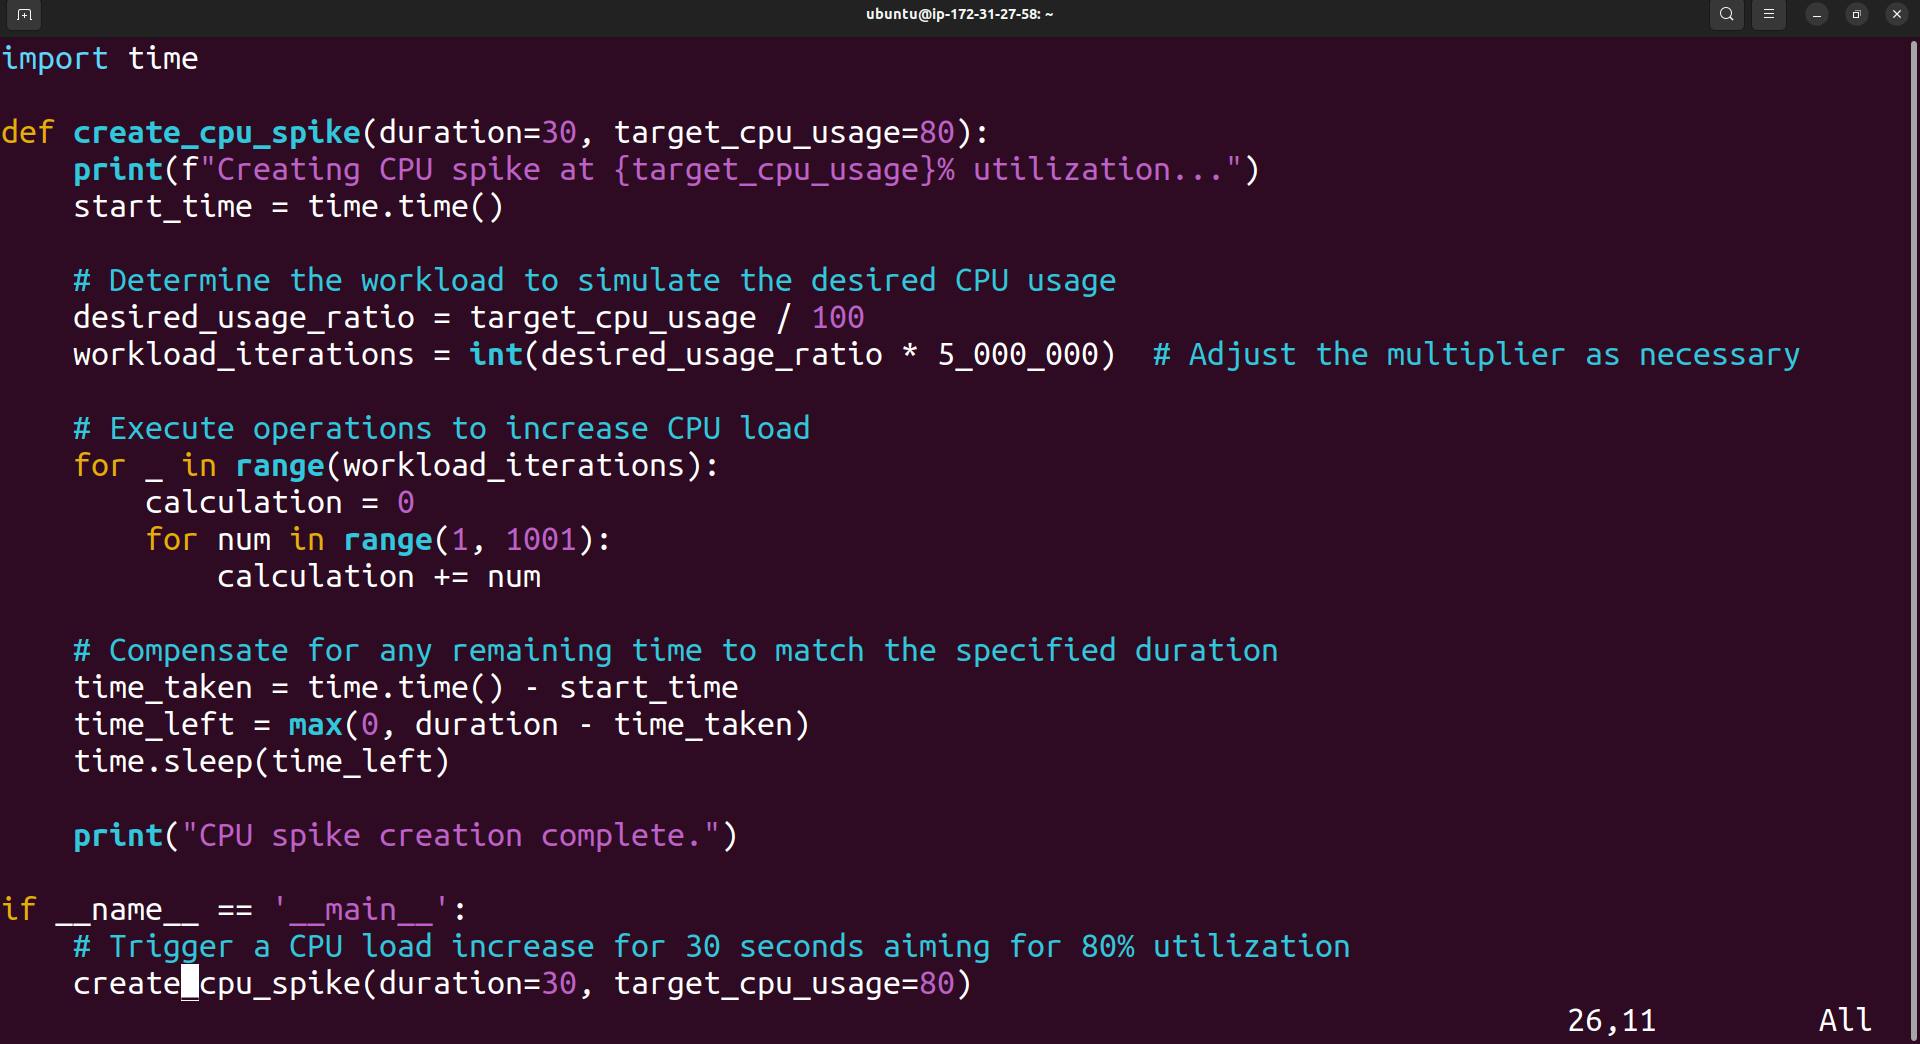
Create a file named cpu_spike.py on the server, and copy the code provided below into it. Save the file afterward.
import time

def create_cpu_spike(duration=30, target_cpu_usage=80):
    print(f"Creating CPU spike at {target_cpu_usage}% utilization...")
    start_time = time.time()

    # Determine the workload to simulate the desired CPU usage
    desired_usage_ratio = target_cpu_usage / 100
    workload_iterations = int(desired_usage_ratio * 5_000_000)  # Adjust the multiplier as necessary

    # Execute operations to increase CPU load
    for _ in range(workload_iterations):
        calculation = 0
        for num in range(1, 1001):
            calculation += num

    # Compensate for any remaining time to match the specified duration
    time_taken = time.time() - start_time
    time_left = max(0, duration - time_taken)
    time.sleep(time_left)

    print("CPU spike creation complete.")

if __name__ == '__main__':
    # Trigger a CPU load increase for 30 seconds aiming for 80% utilization
    create_cpu_spike(duration=30, target_cpu_usage=80)

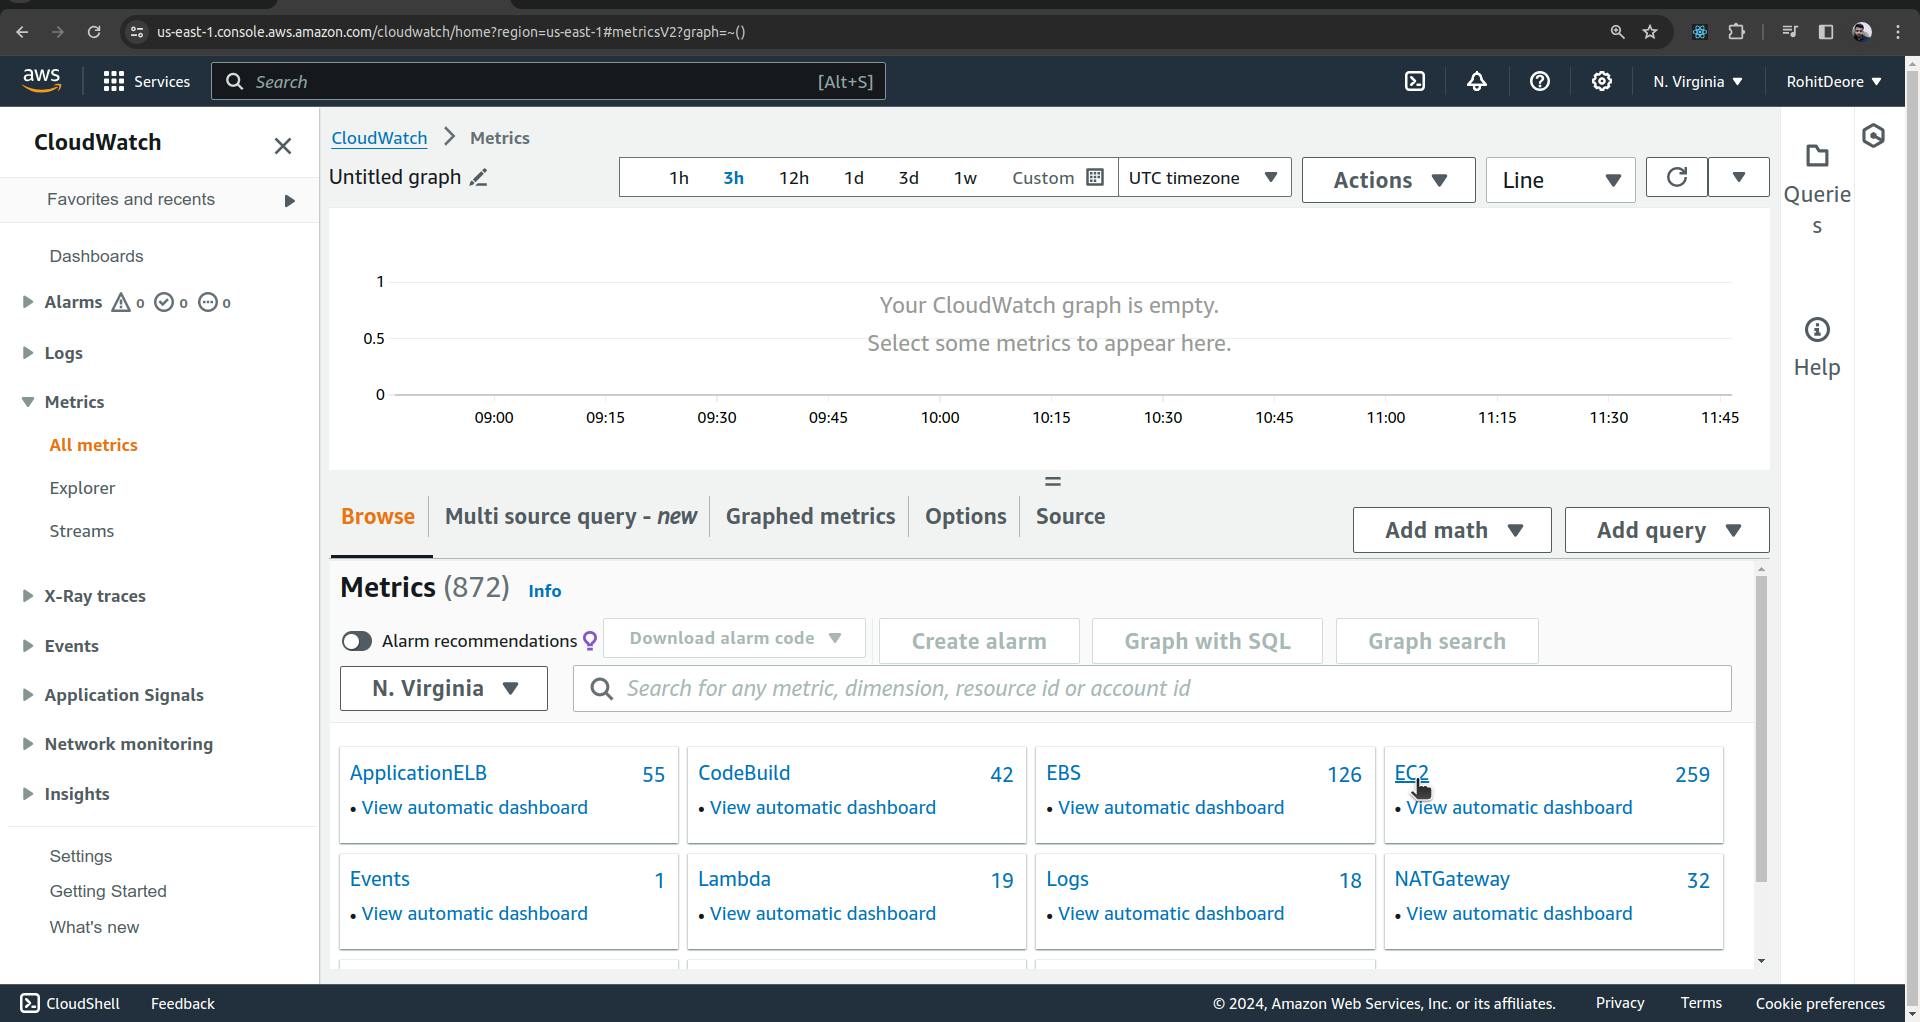
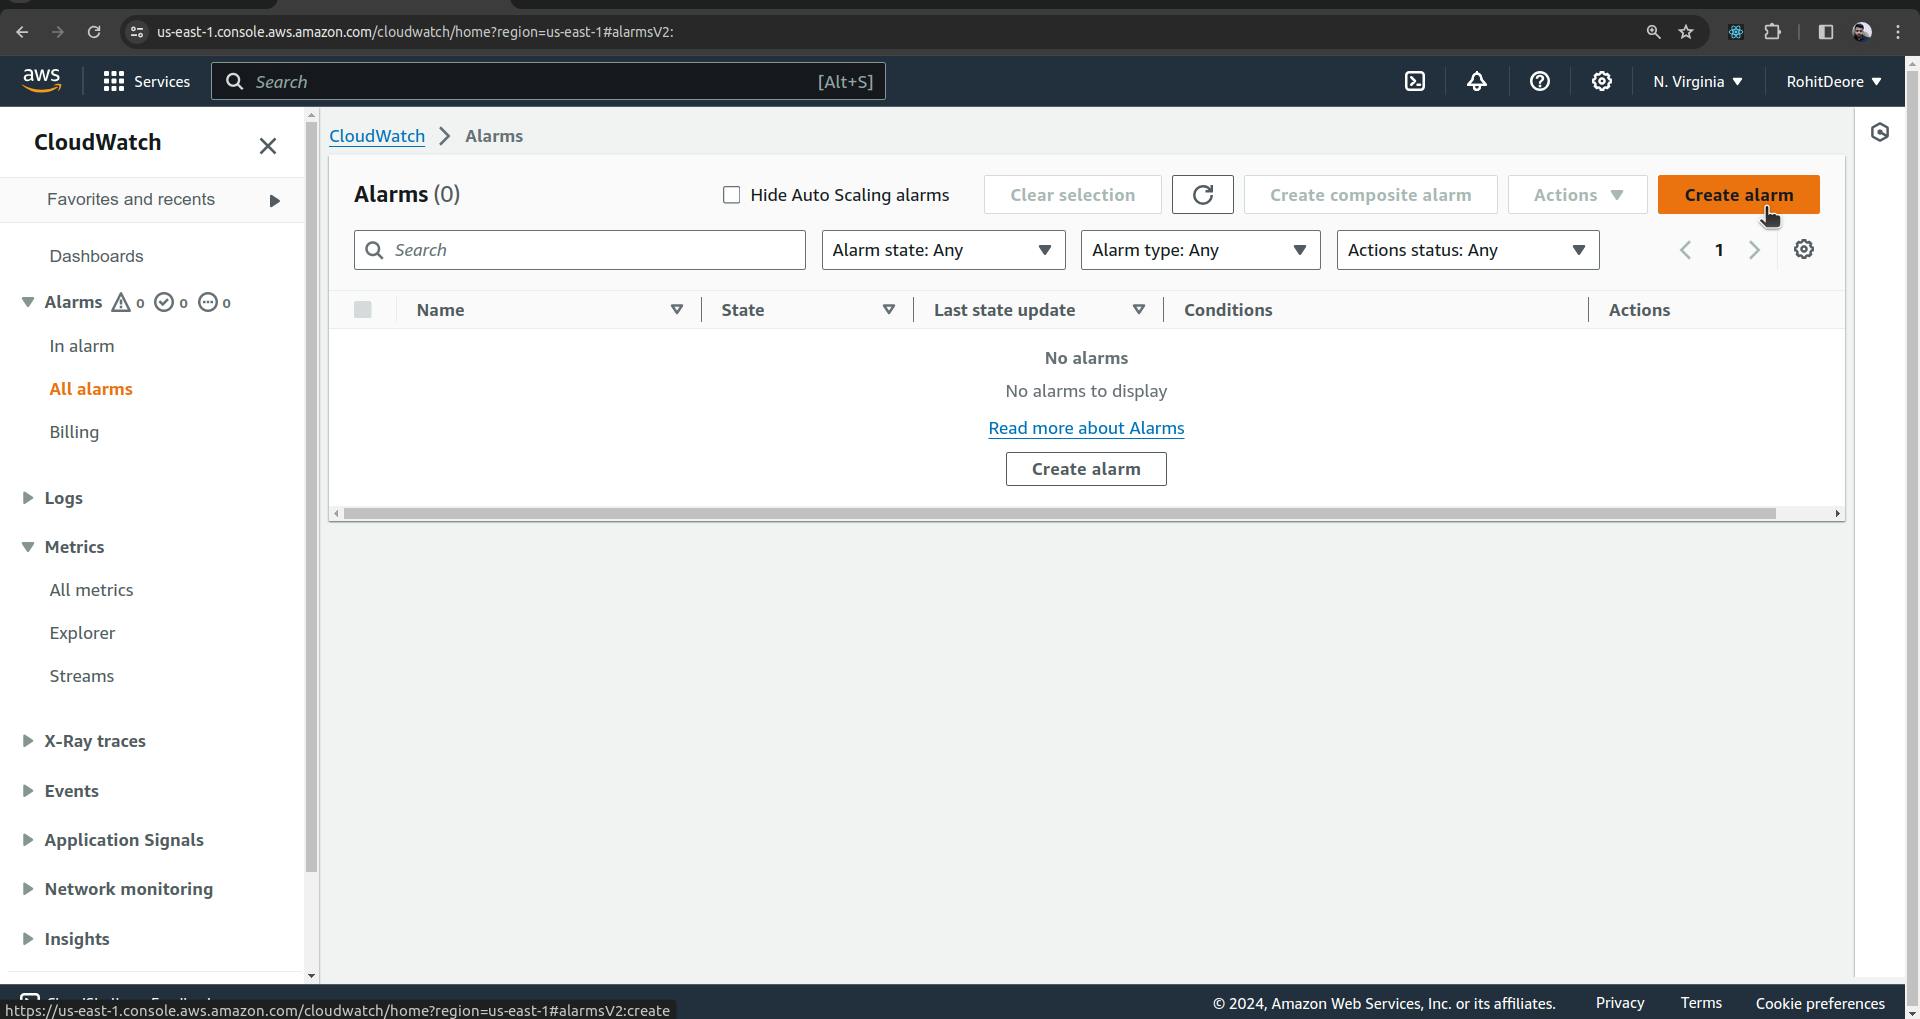
Now, go to CloudWatch and track the metrics of the EC2 instance we just created.
Search for CloudWatch

Go to all metrics

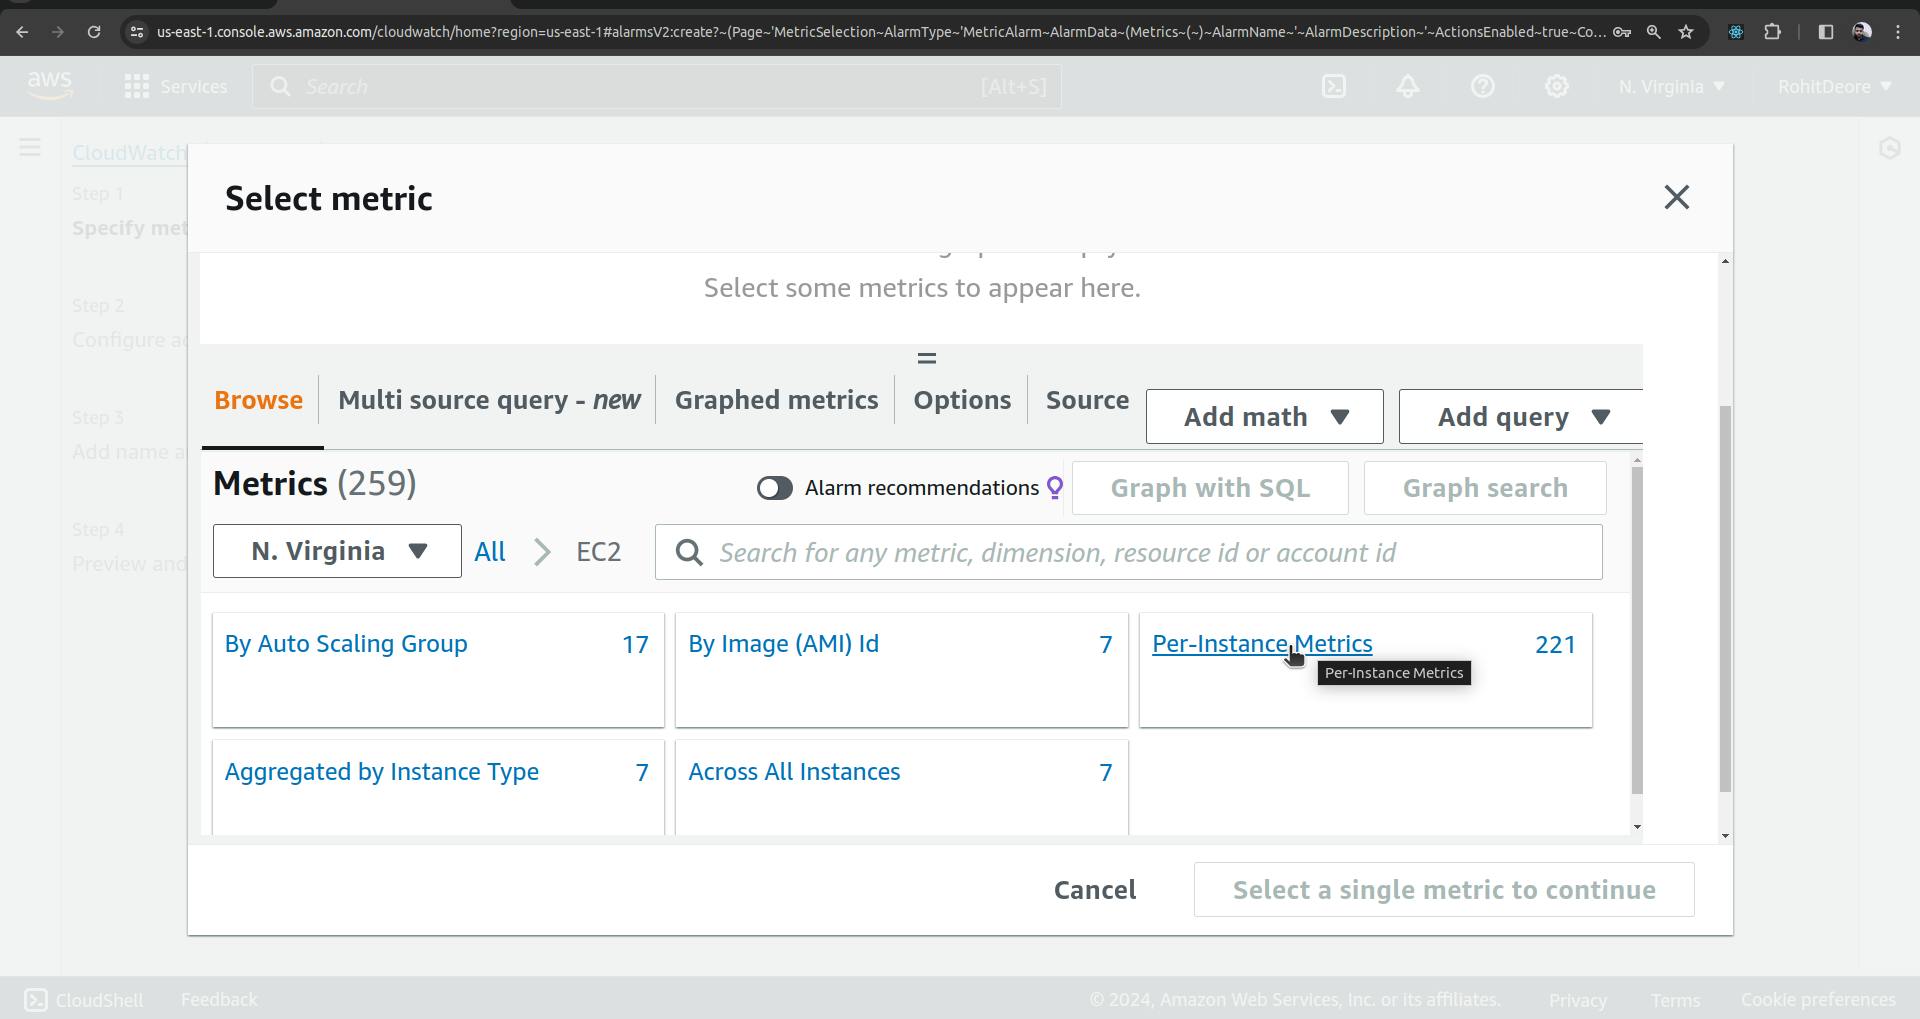
Click on EC2
Click on Per-Instance Metrics
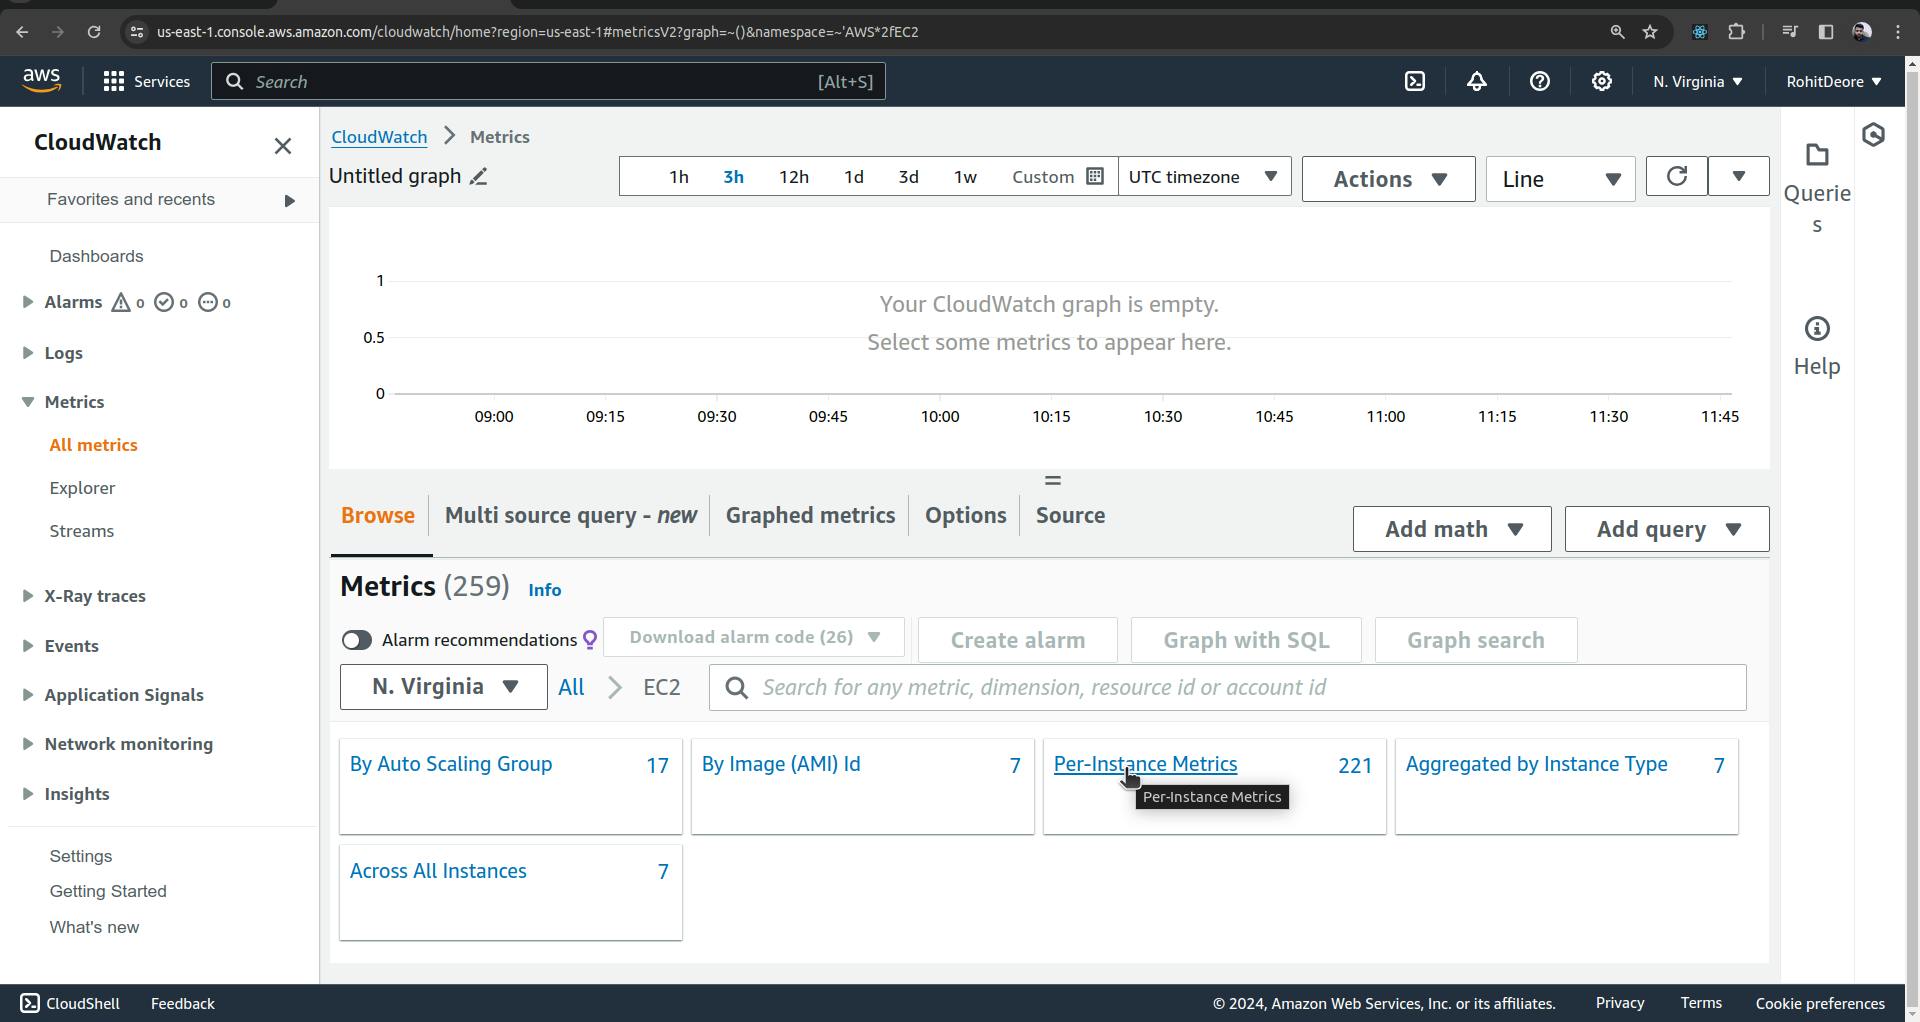
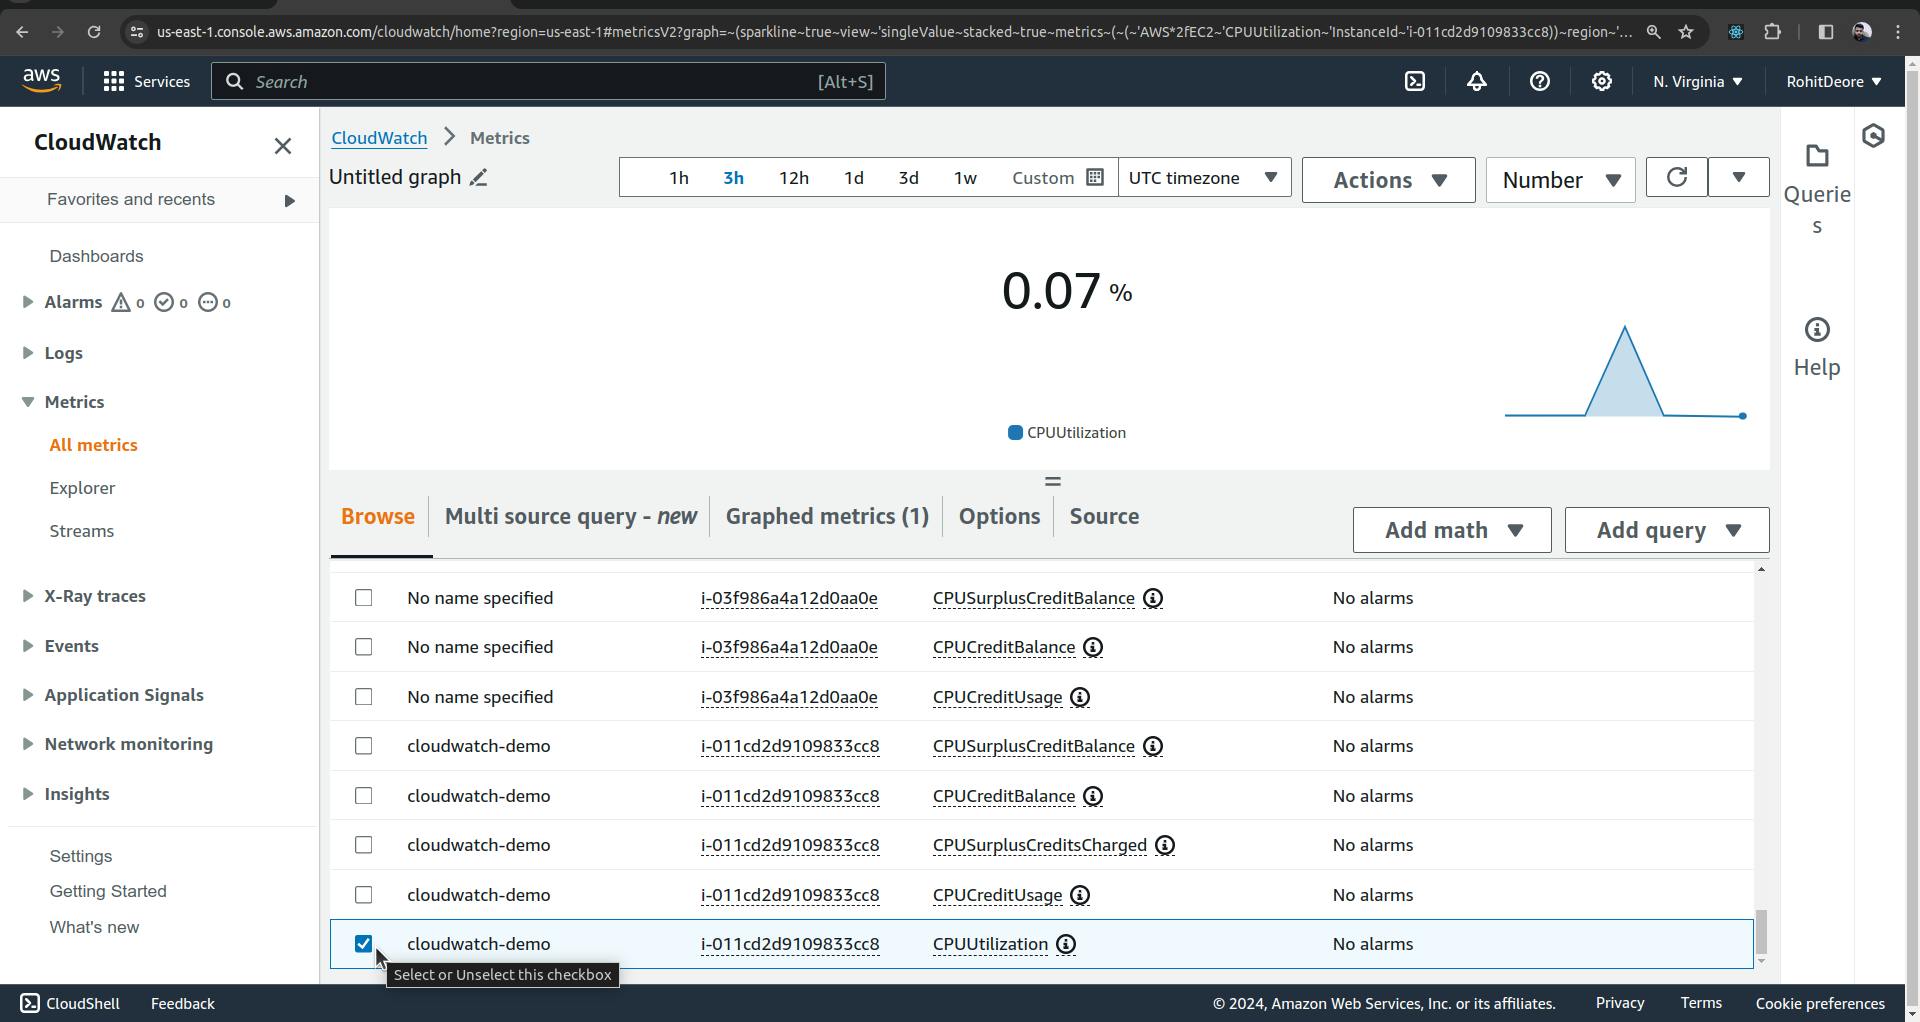
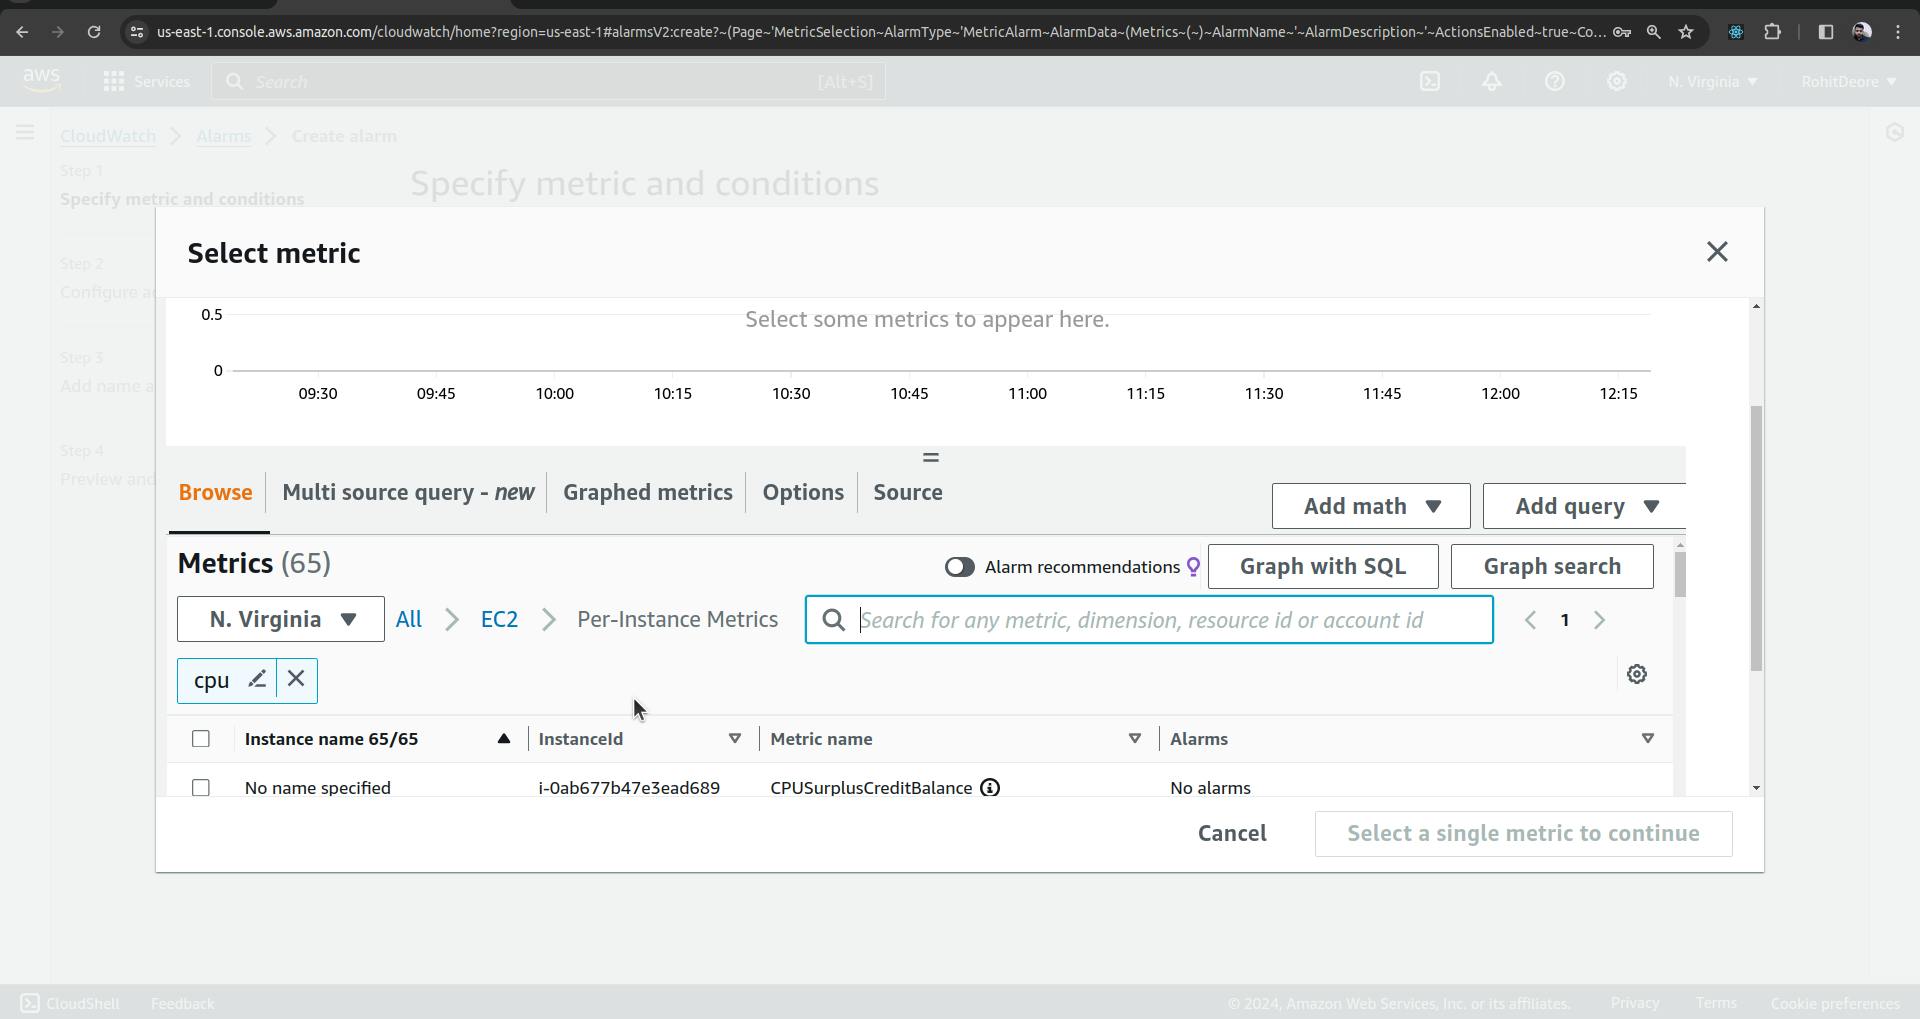
Search for 'CPU', and you will see a list below. Just find your EC2 instance in that list, select it, and it will display the CPU utilization.
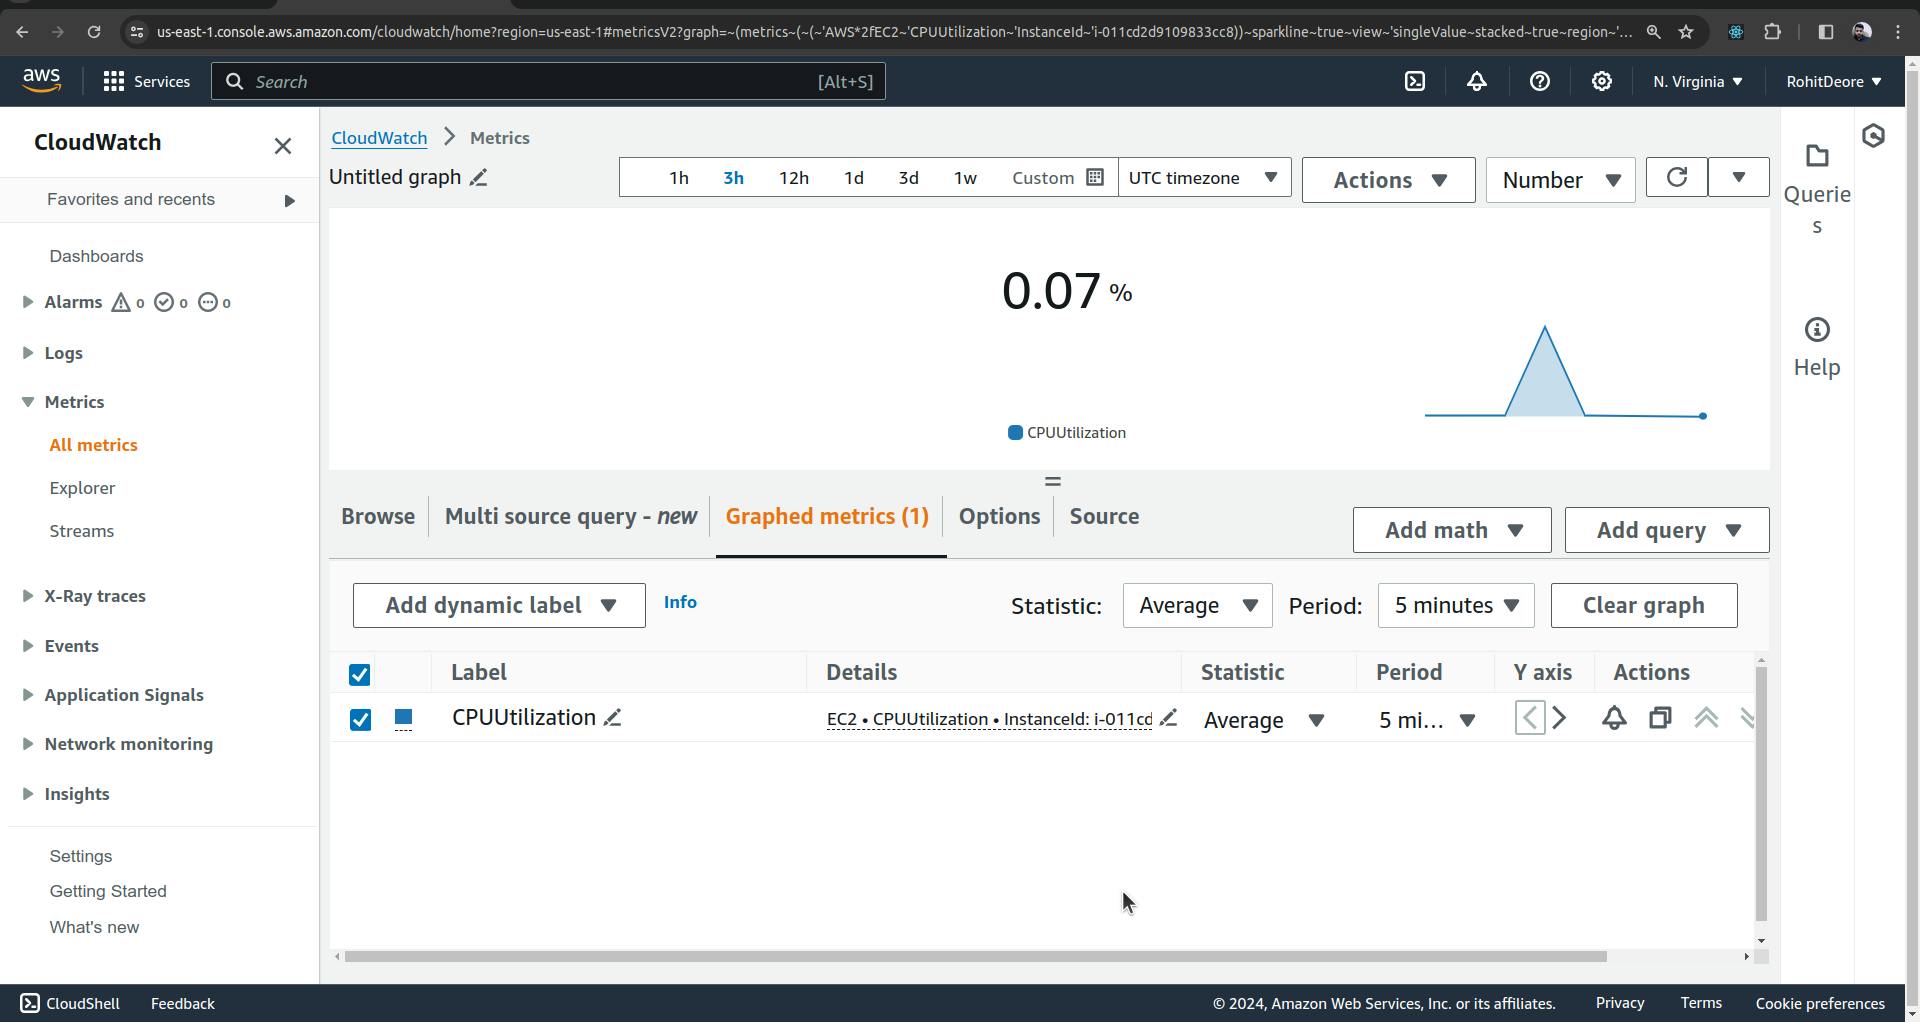
Now, we can run the script cpu_spike.py to see how CloudWatch provides metrics for EC2. Before doing that, go to the Graphed Metrics section, change the statistic to 'Maximum,' and also change the period to 1 minute.

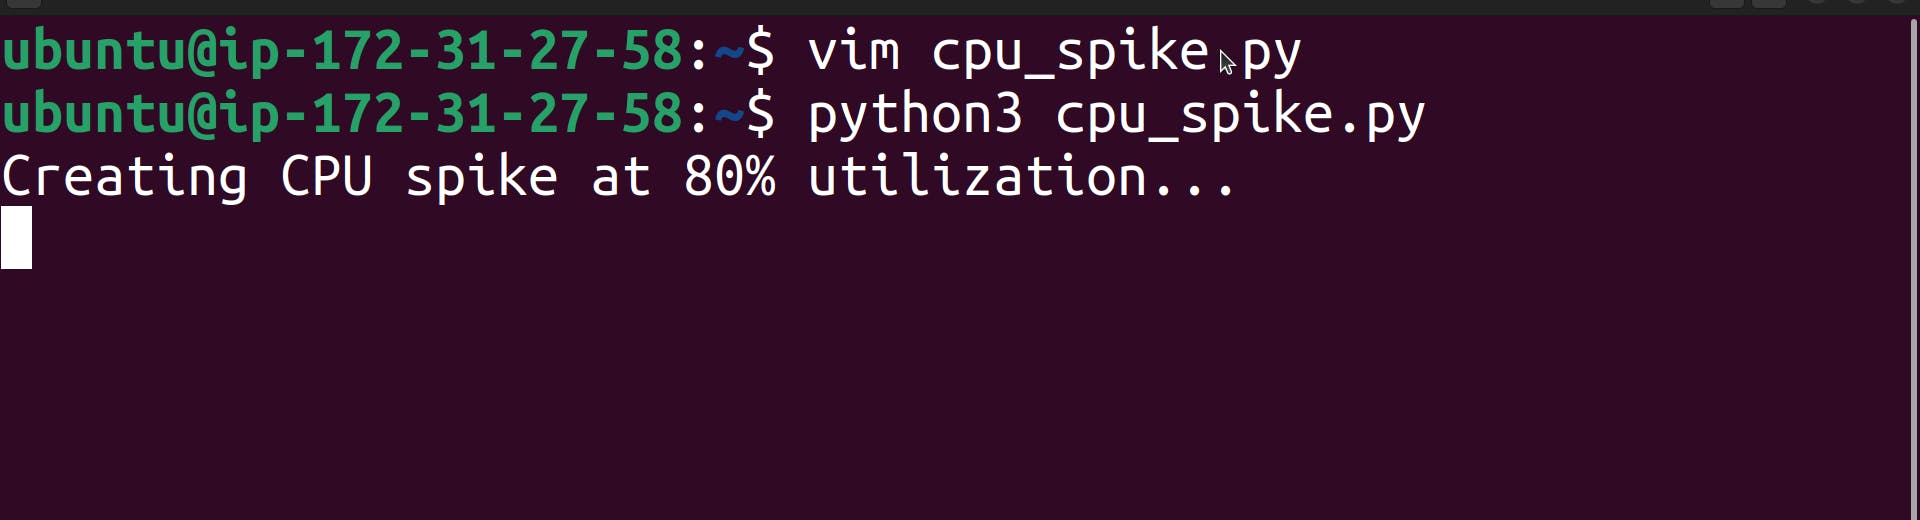
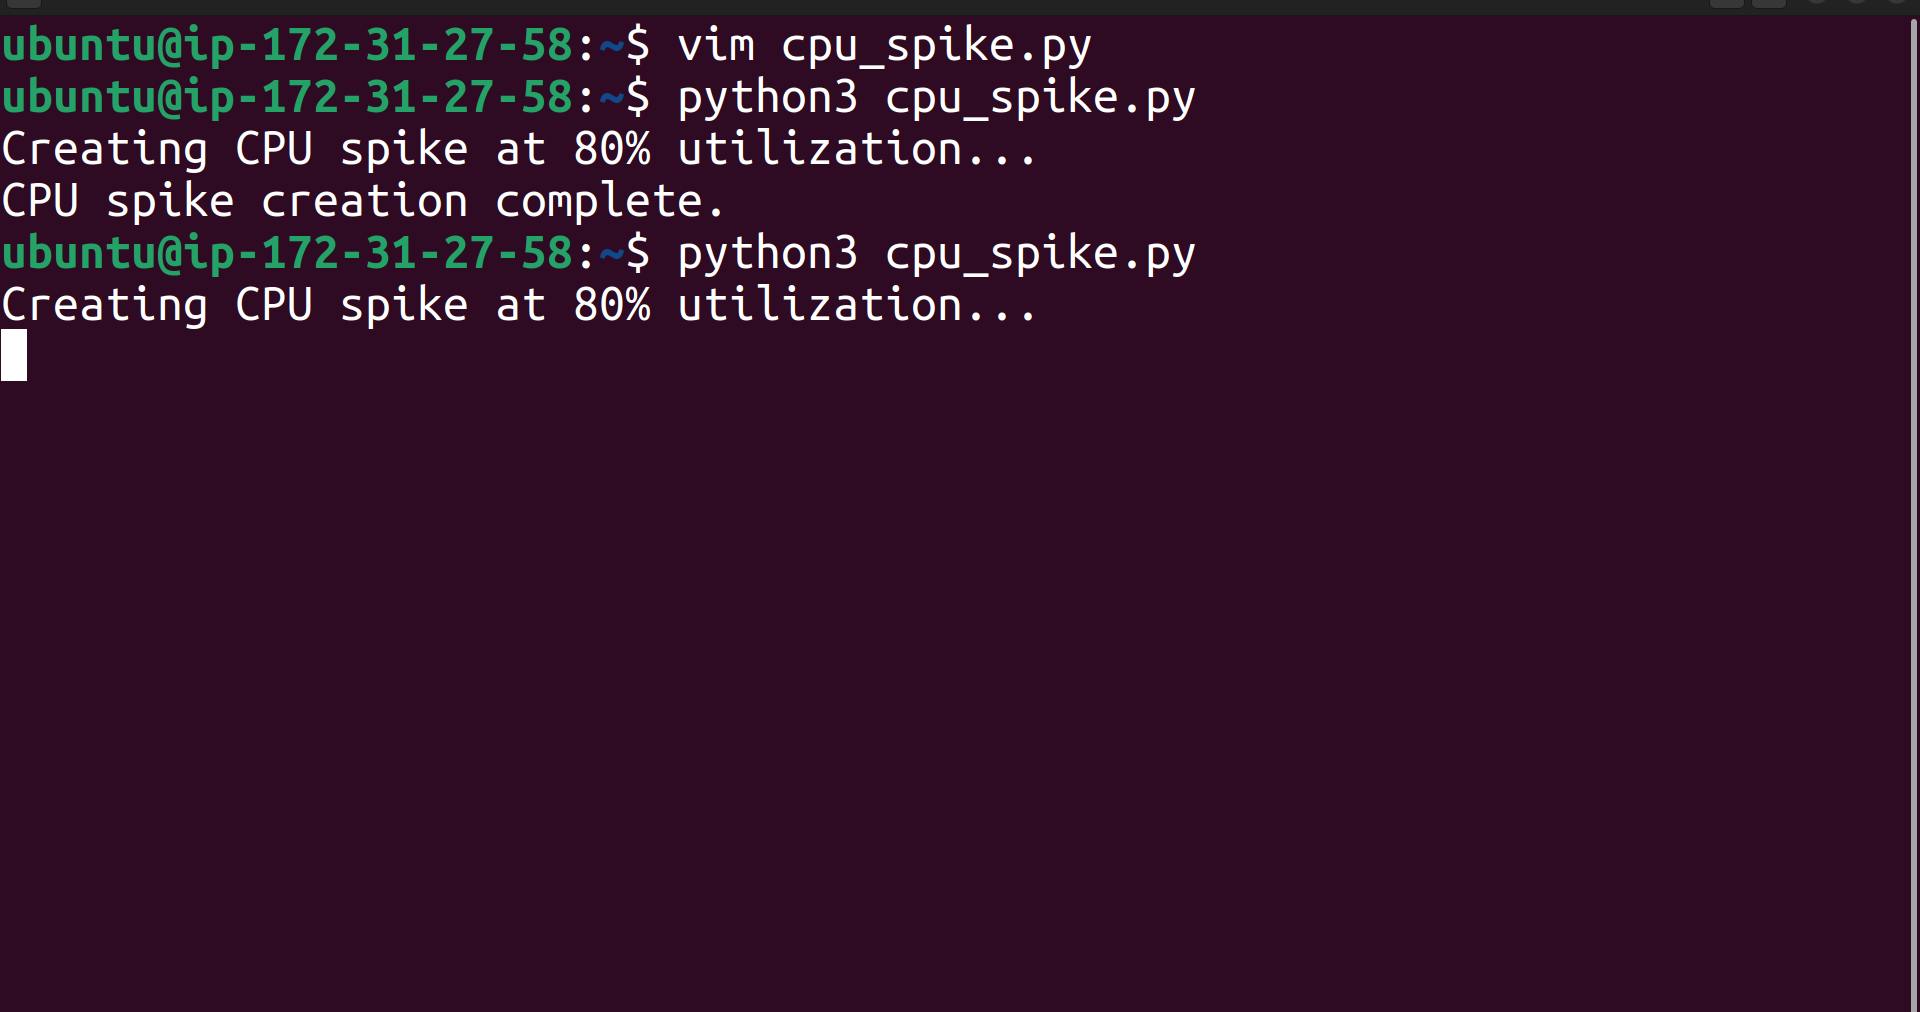
Now we will run the Python script, which will increase the CPU utilization.
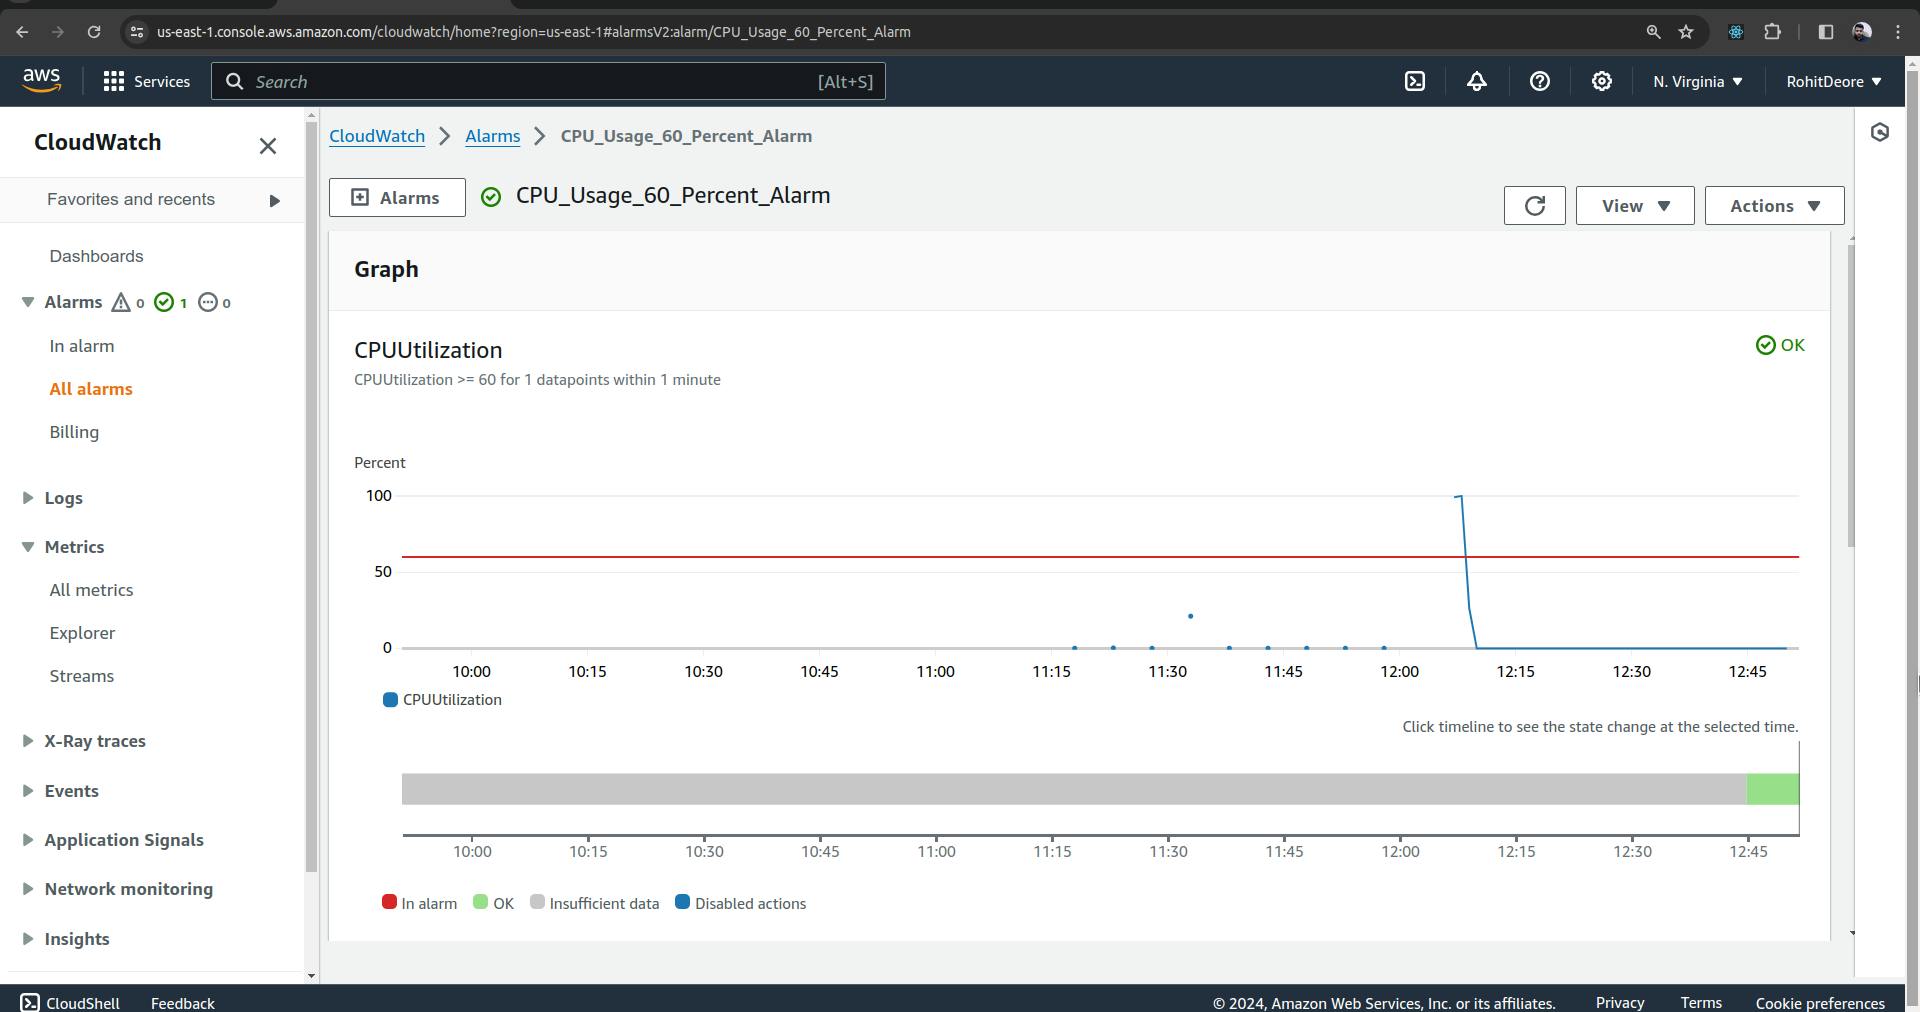
You can see that CPU utilization has increased in the image below.

Now we have this information about an increase in CPU utilization. We need to report these kinds of issues. For this purpose, we can configure an alarm in CloudWatch.
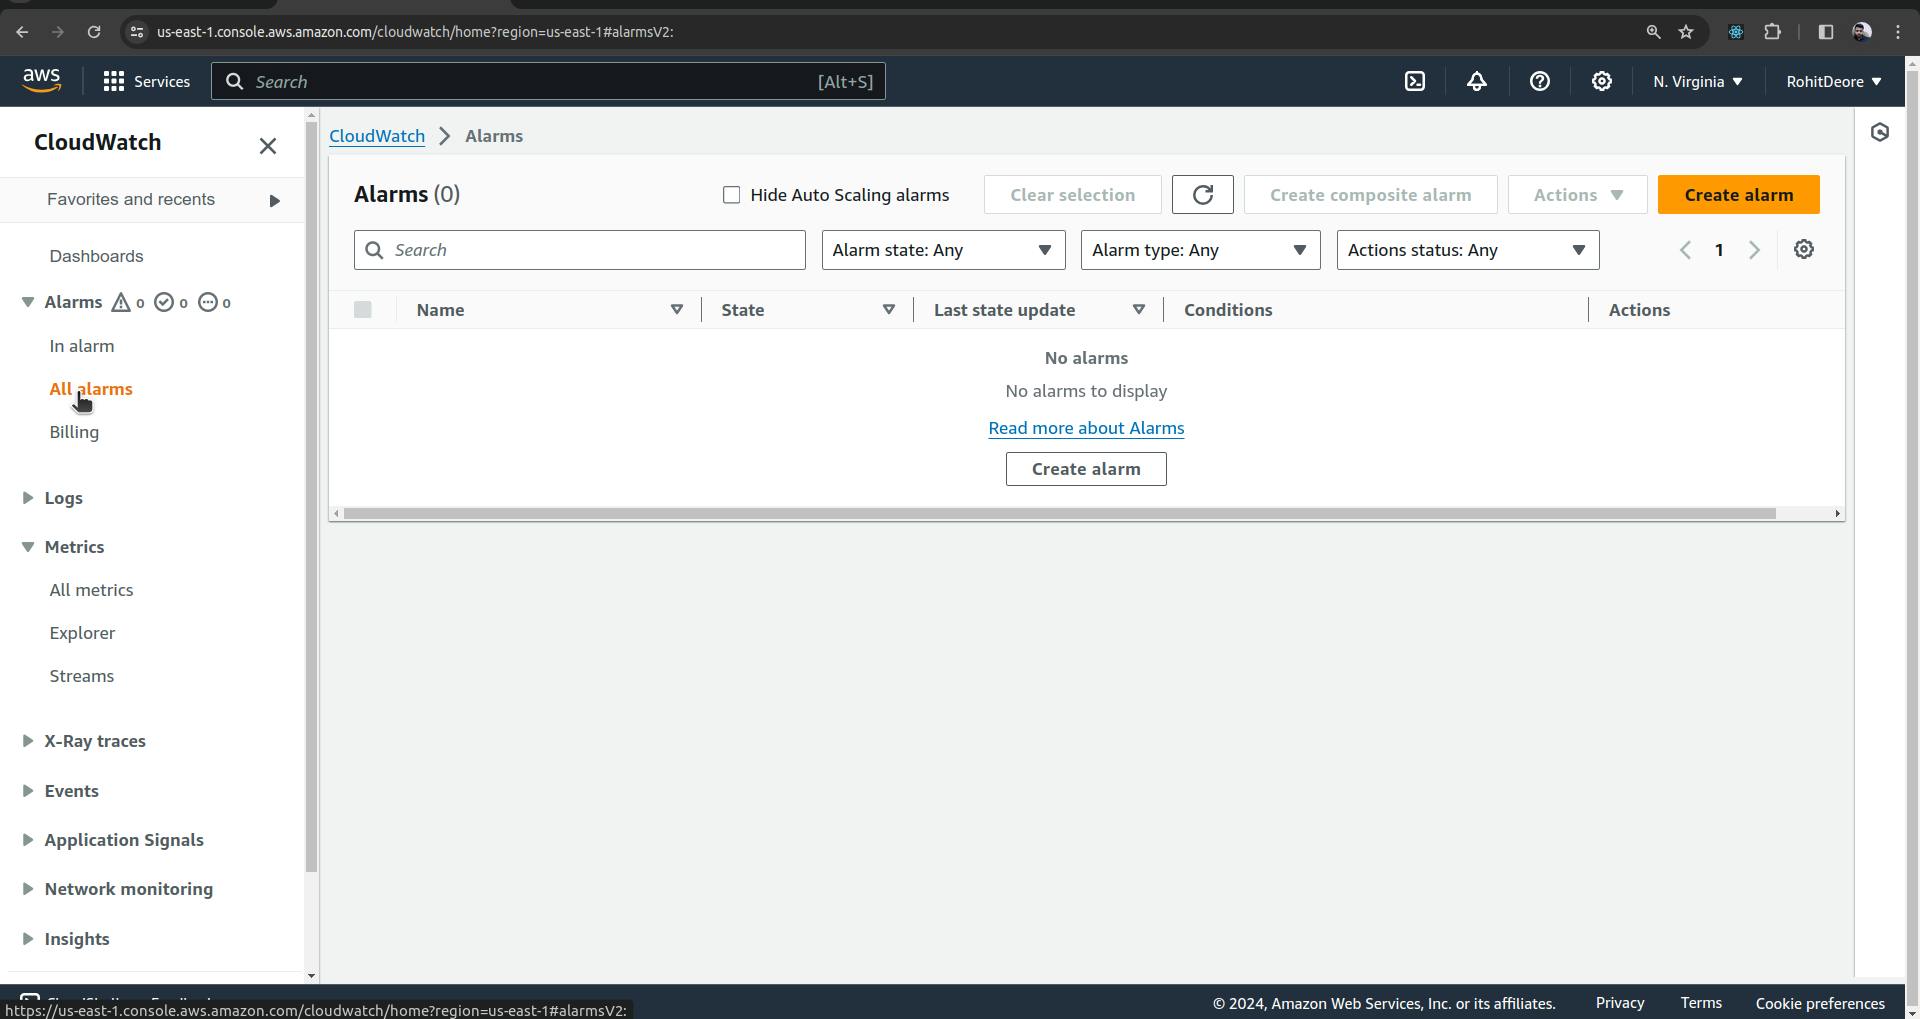
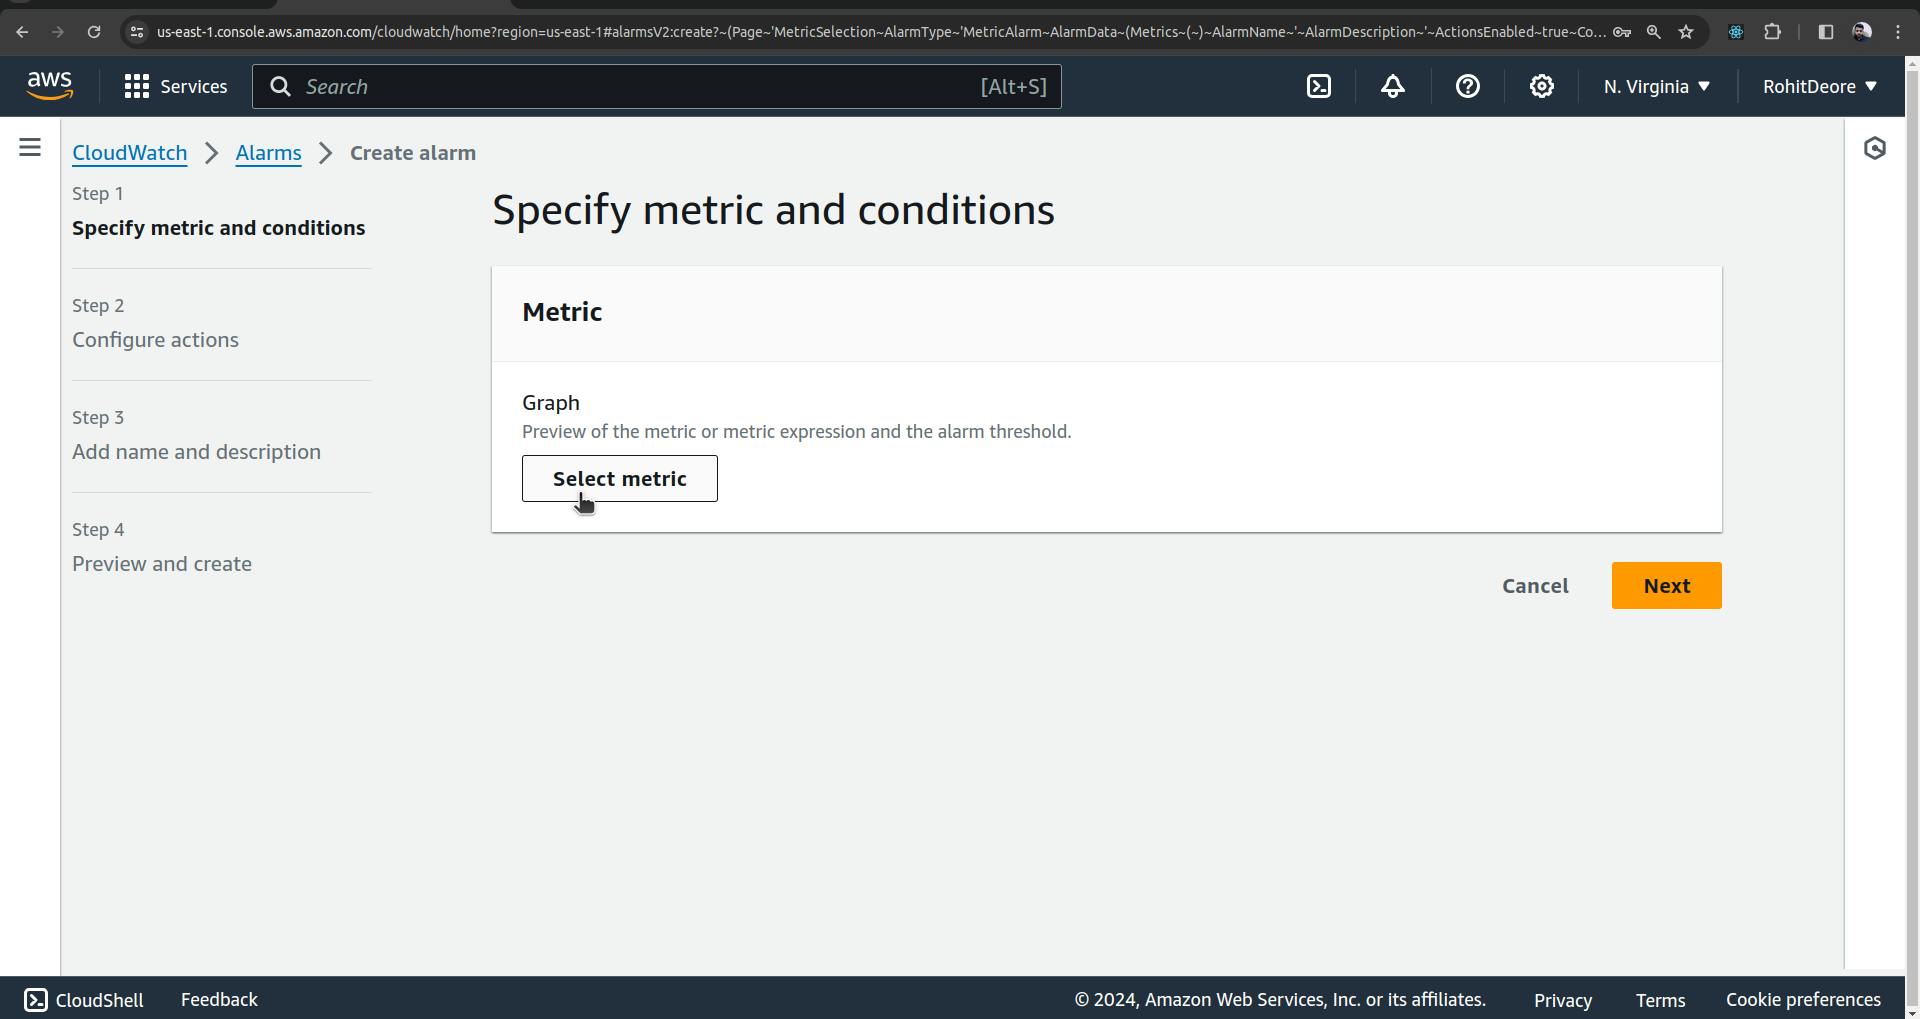
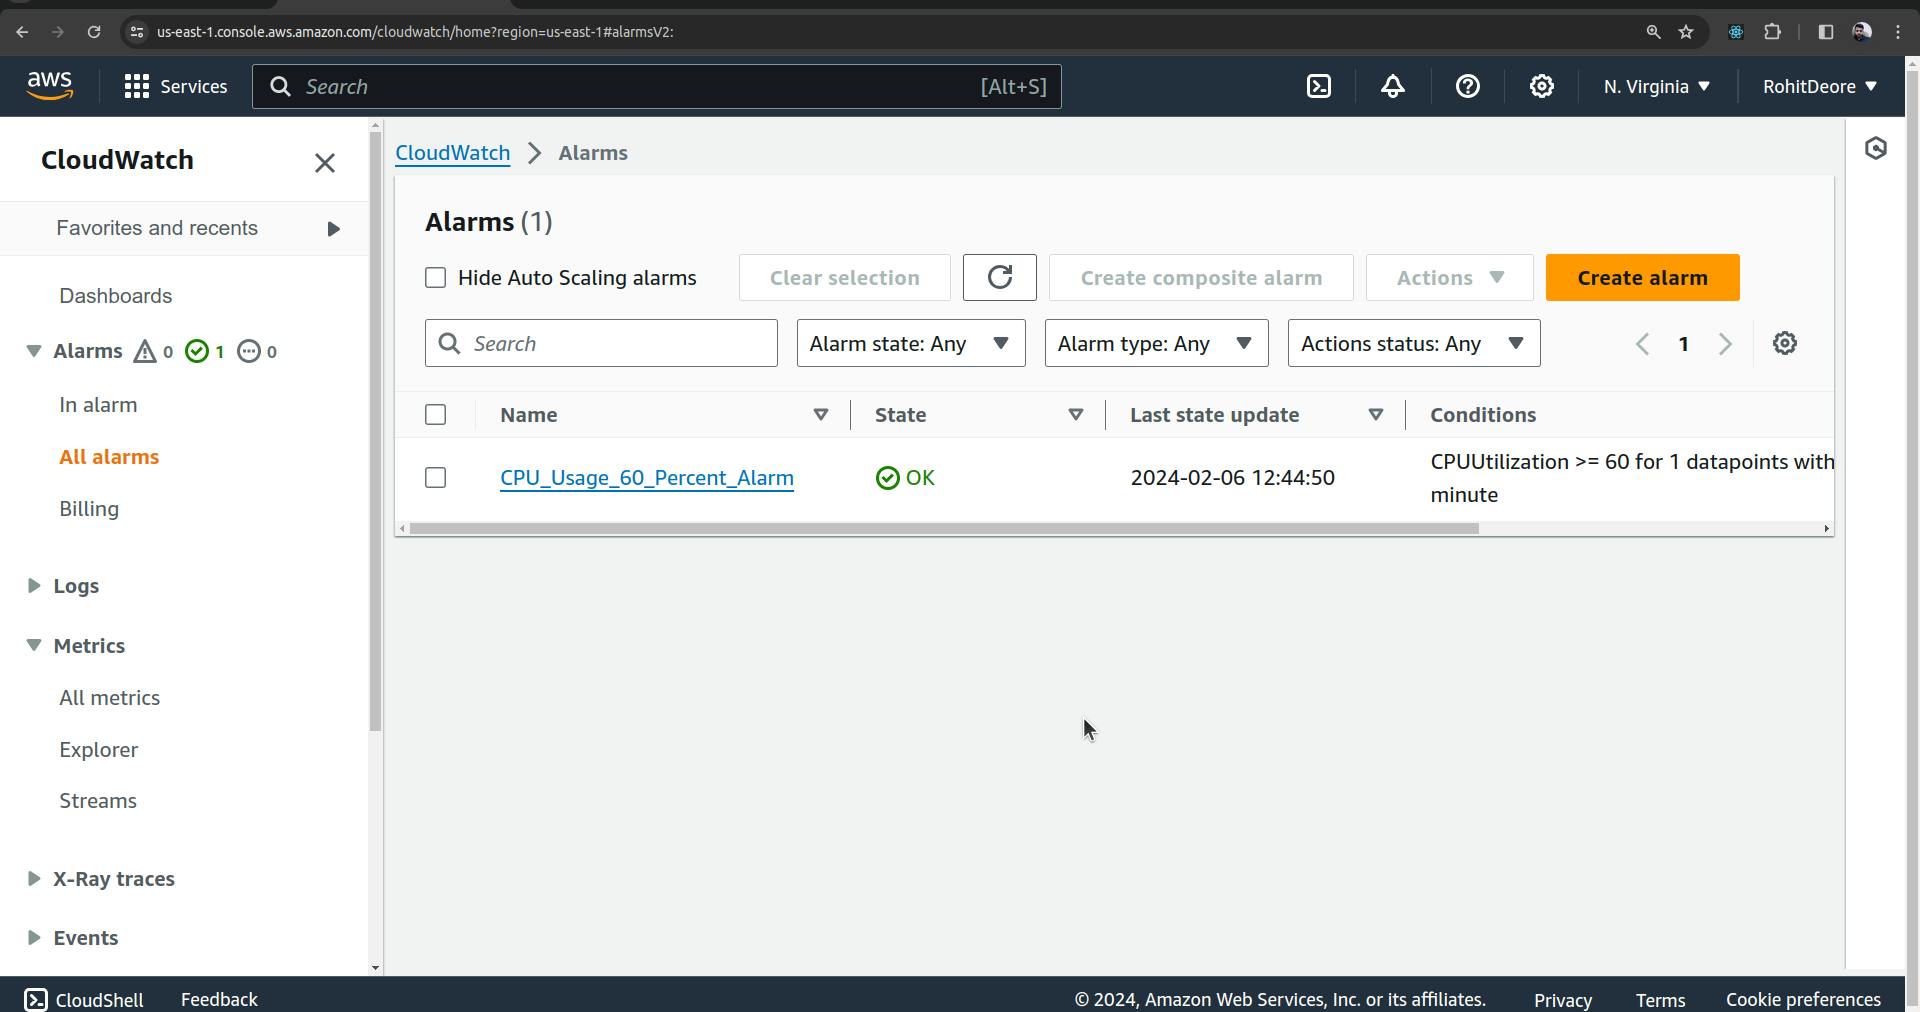
Go to the alarm section and create an alarm.

Search for 'CPU' and press 'Enter'. Find the instance in the list below and select it.

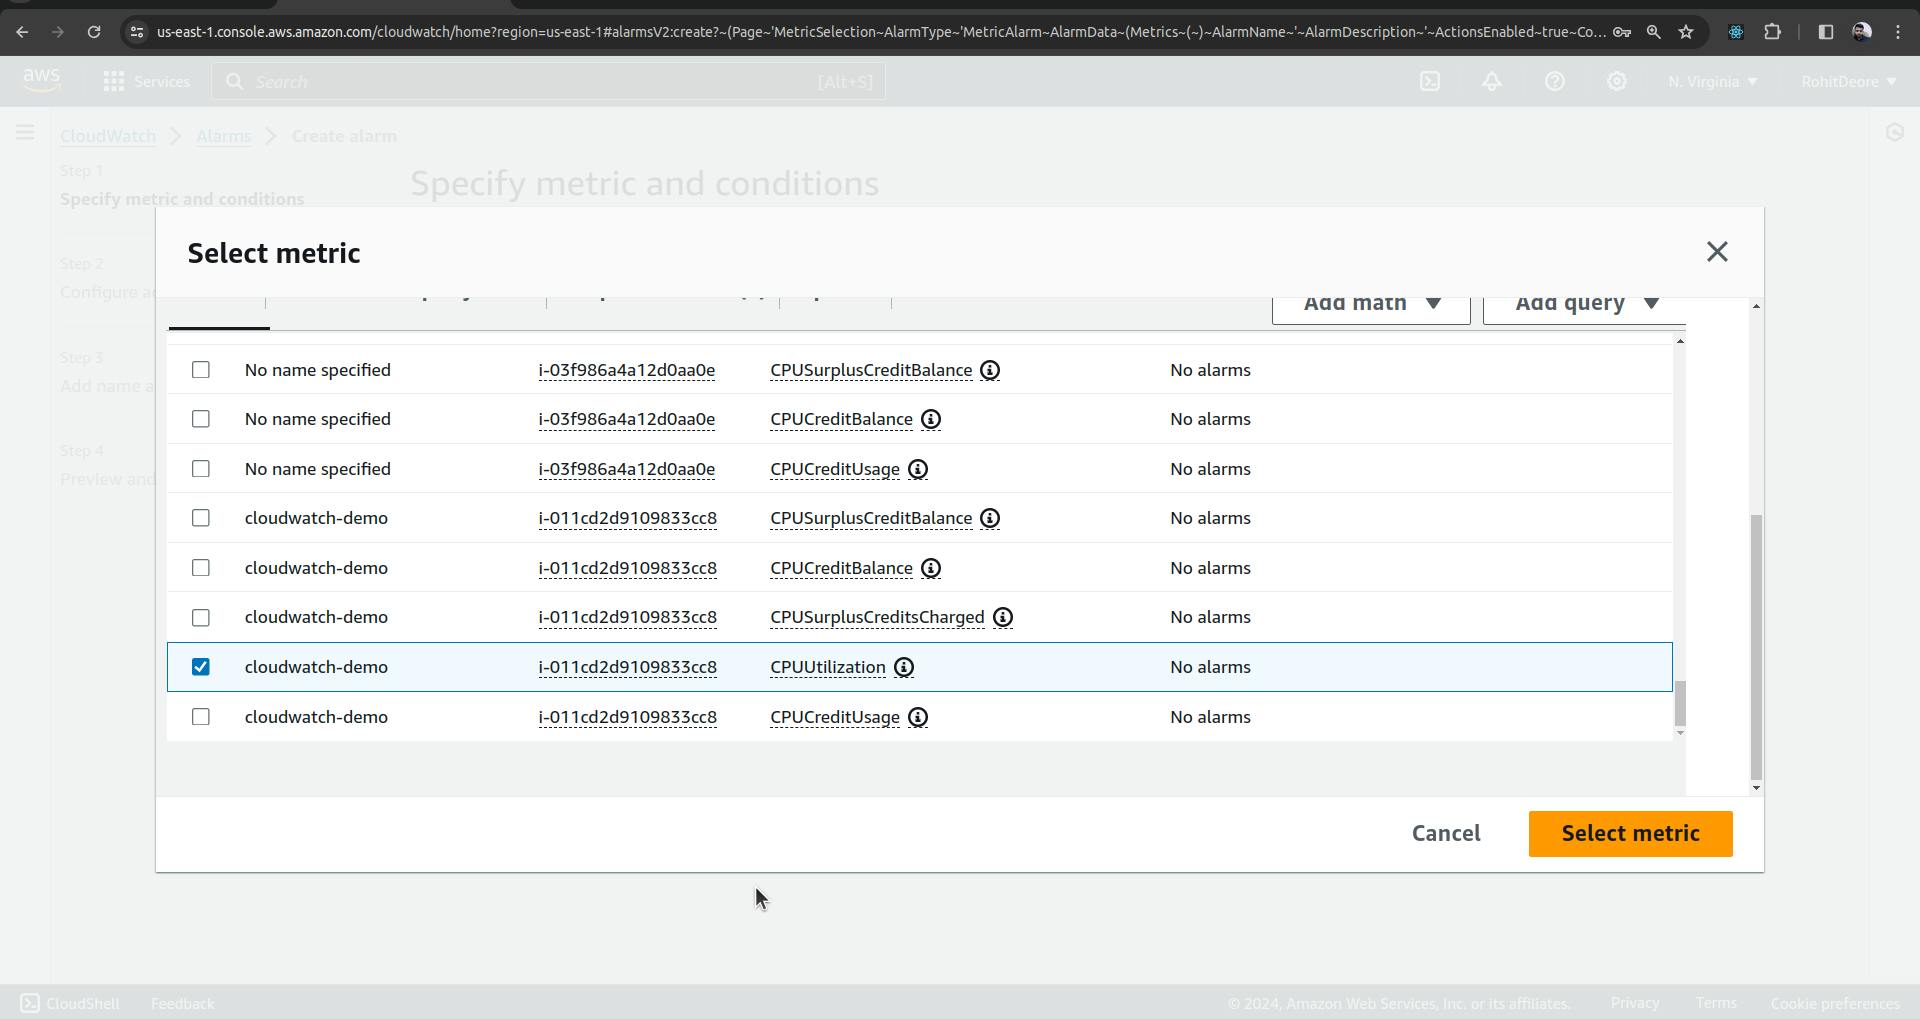
Click on Select Metric

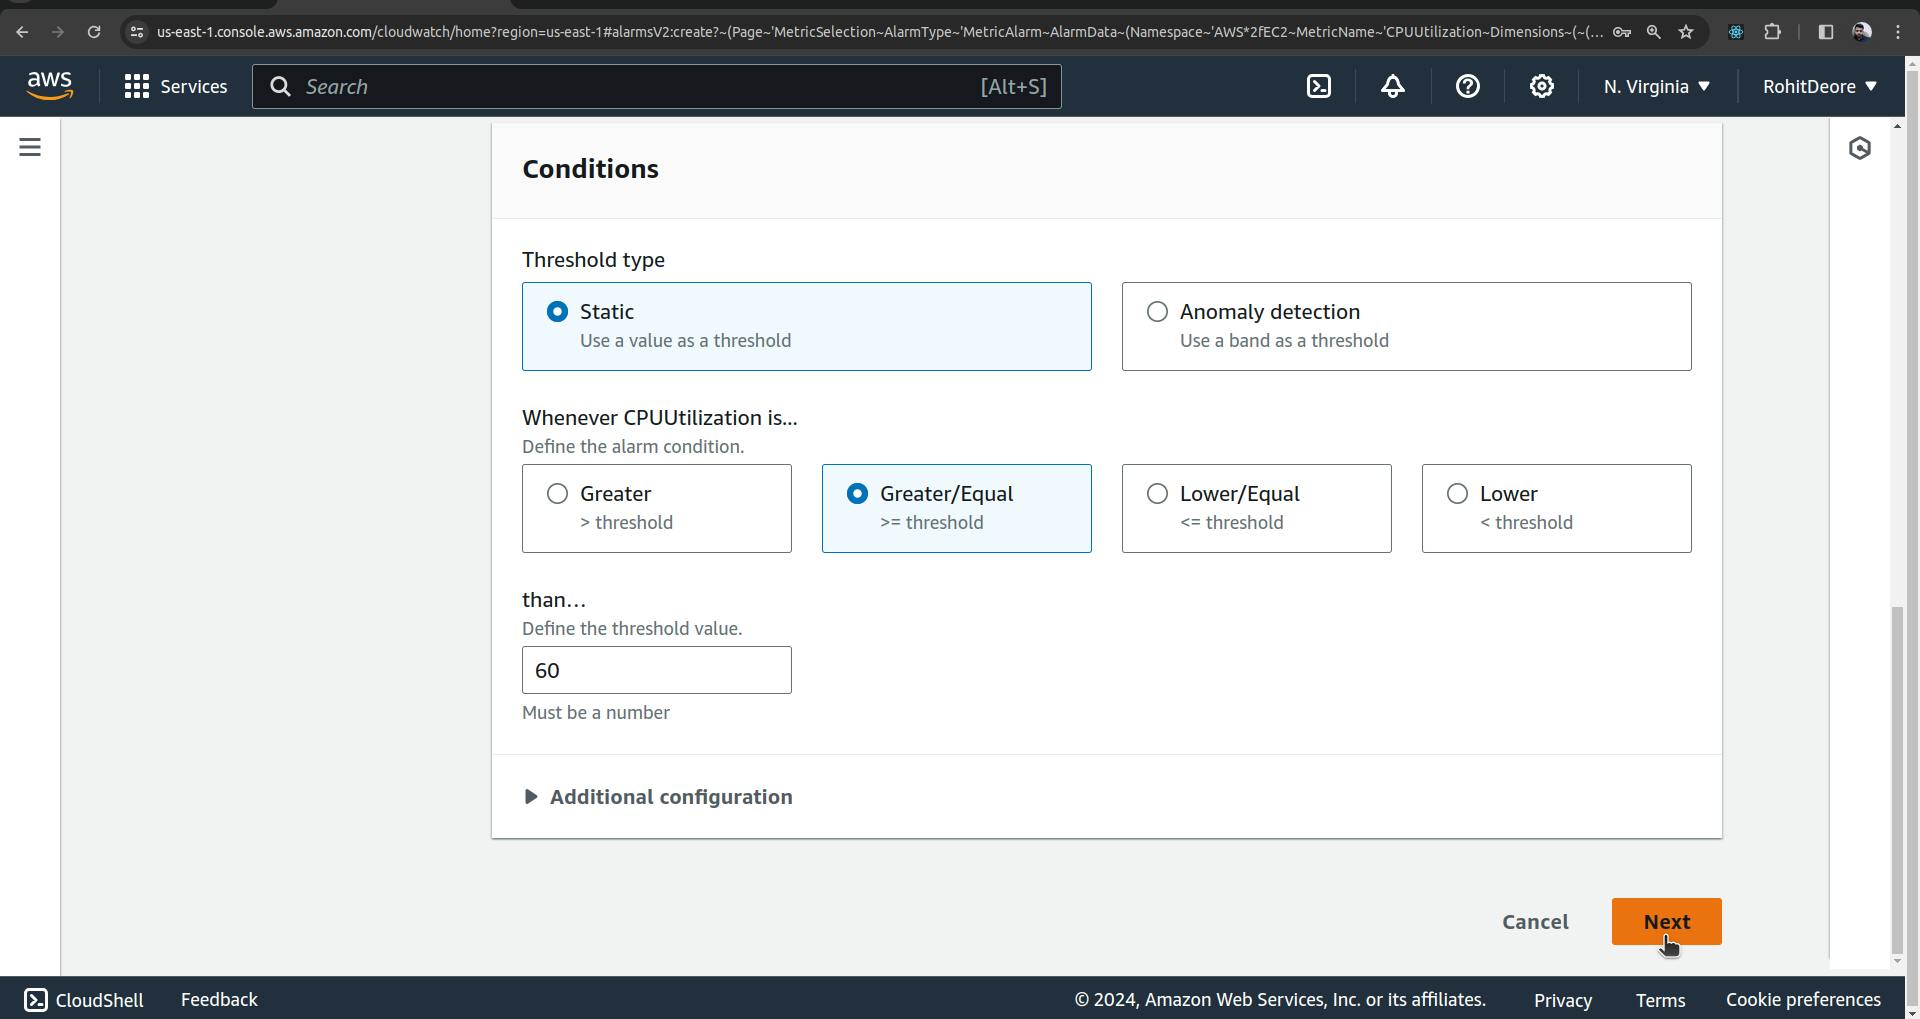
Change the statistic to 'Maximum' and the period to '1 minute'.

Choose 'Greater/Equal' and change the threshold value to '60'.

Click on Next
Select 'In Alarm', then choose 'Create New Topic'. After that, enter a topic name and click on 'Create Topic'.


Scroll down and click on 'Next'.

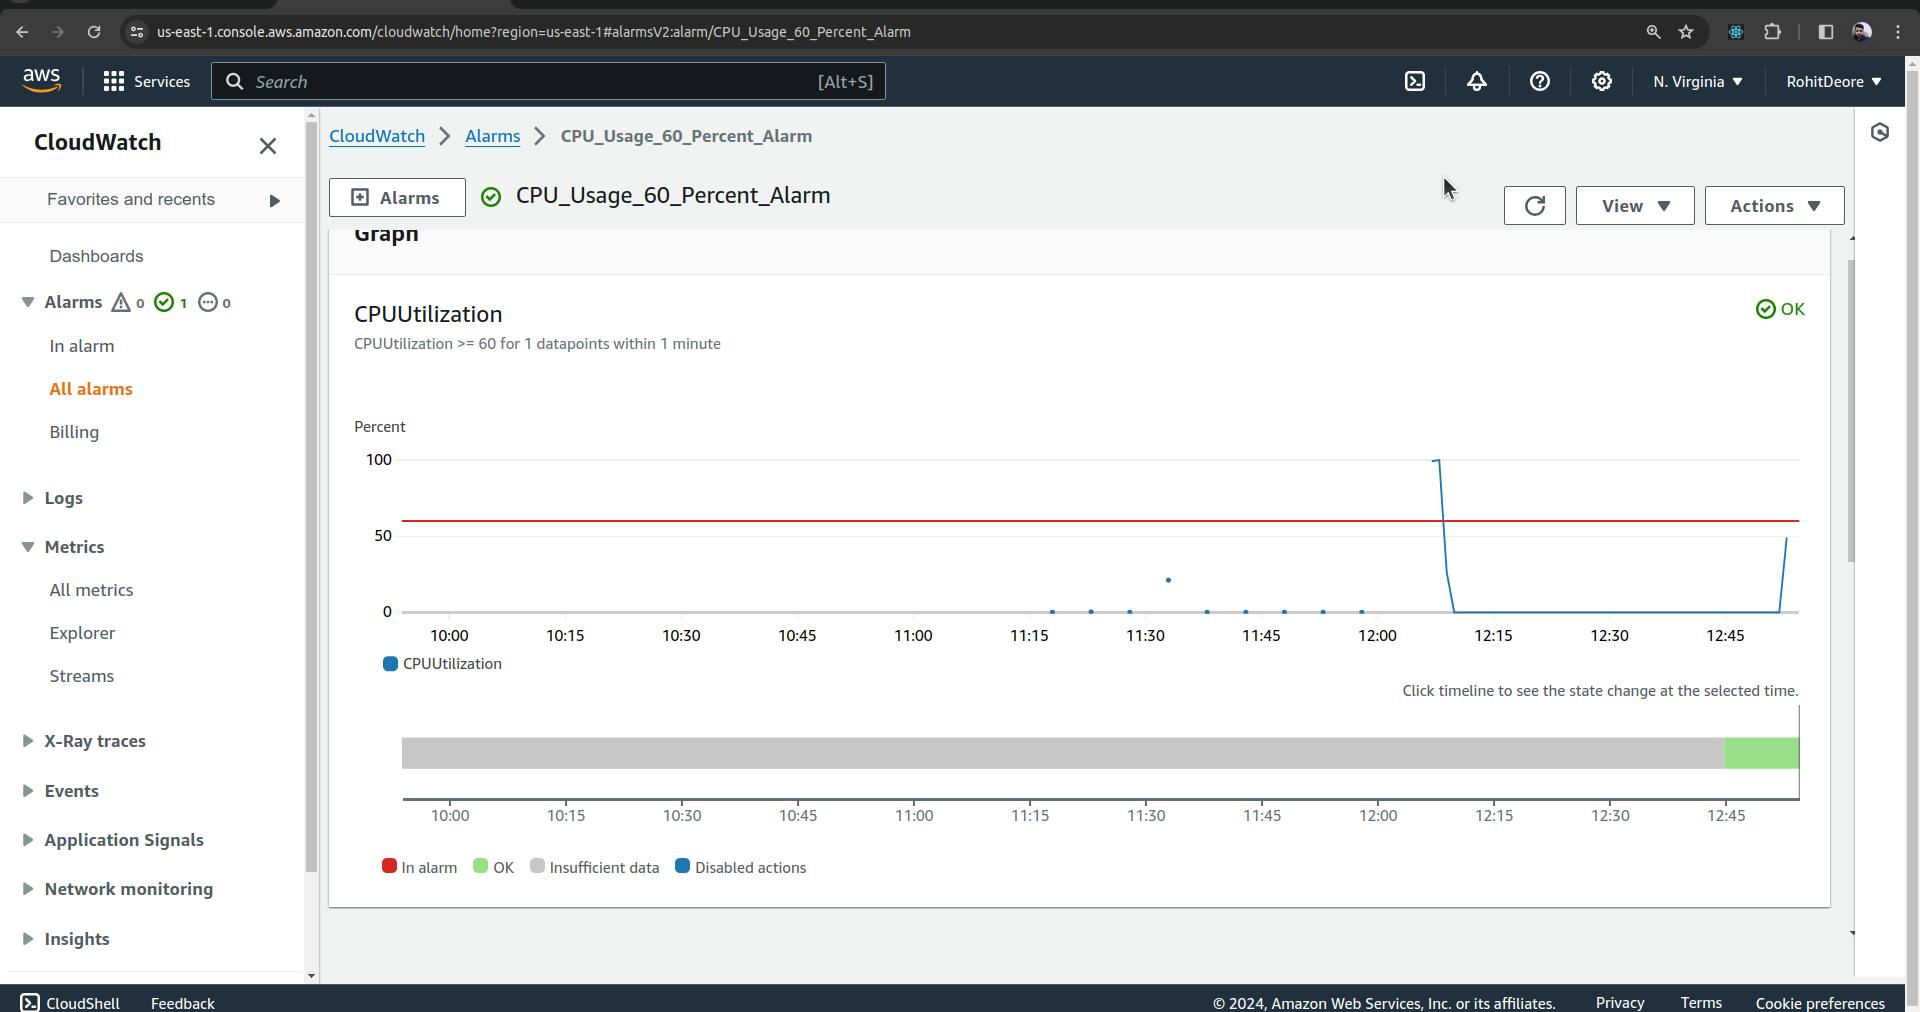
Enter an 'Alarm Name' and provide an 'Alarm Description', then click on 'Next'.

Scroll down and click on 'Create alarm.

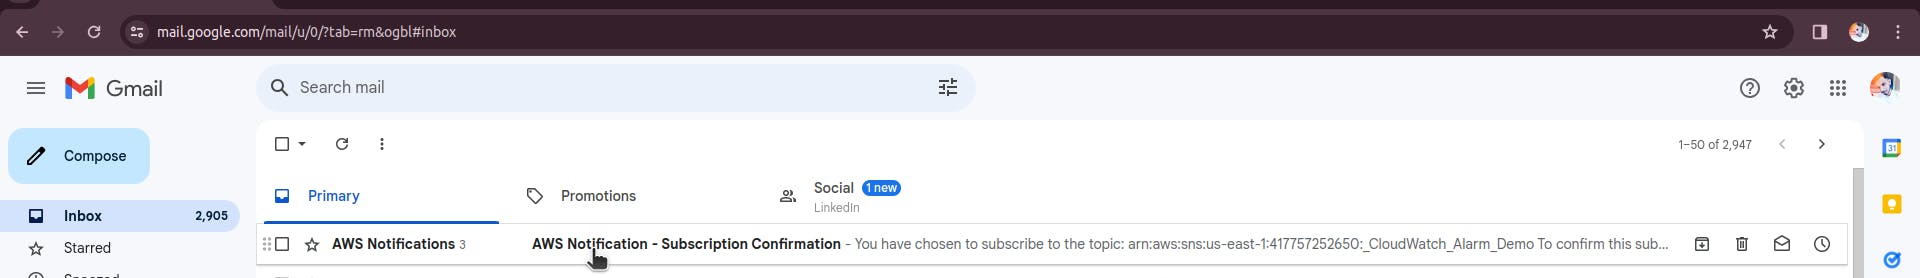
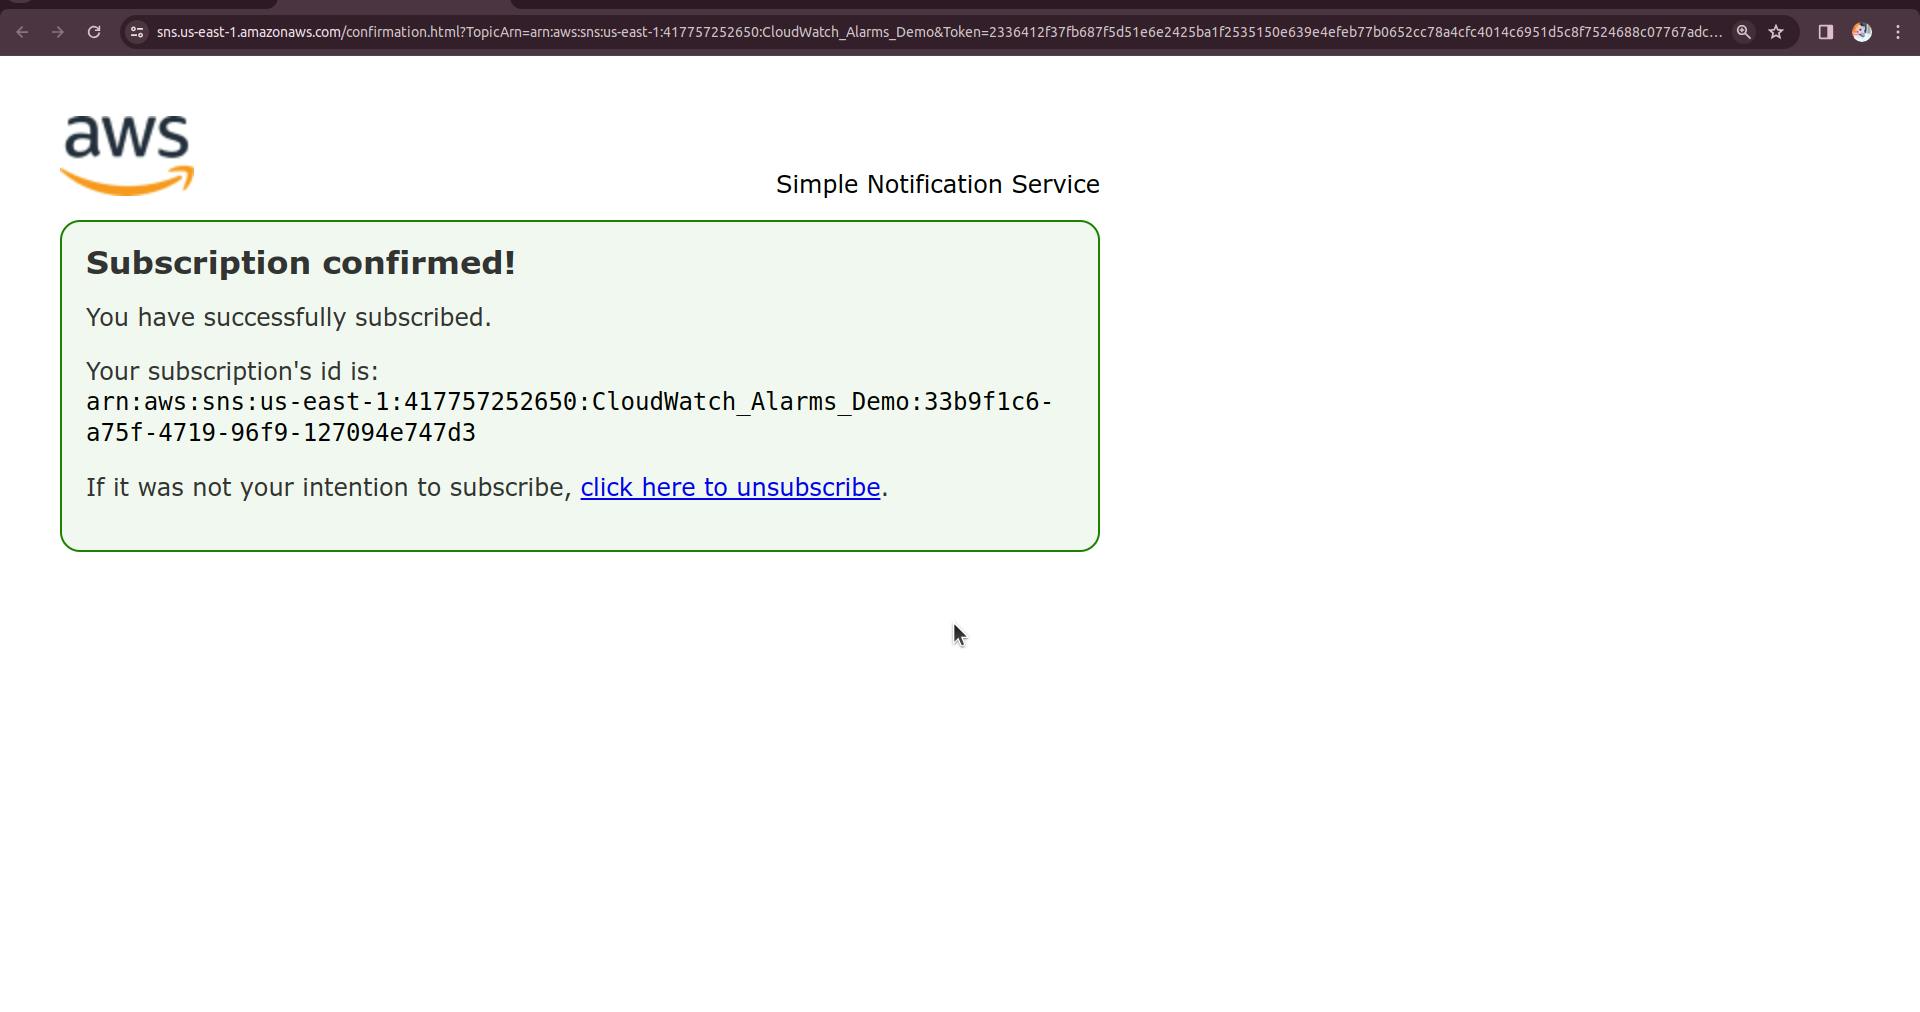
Check email to confirm the subscription.

Click on 'Confirm Subscription.
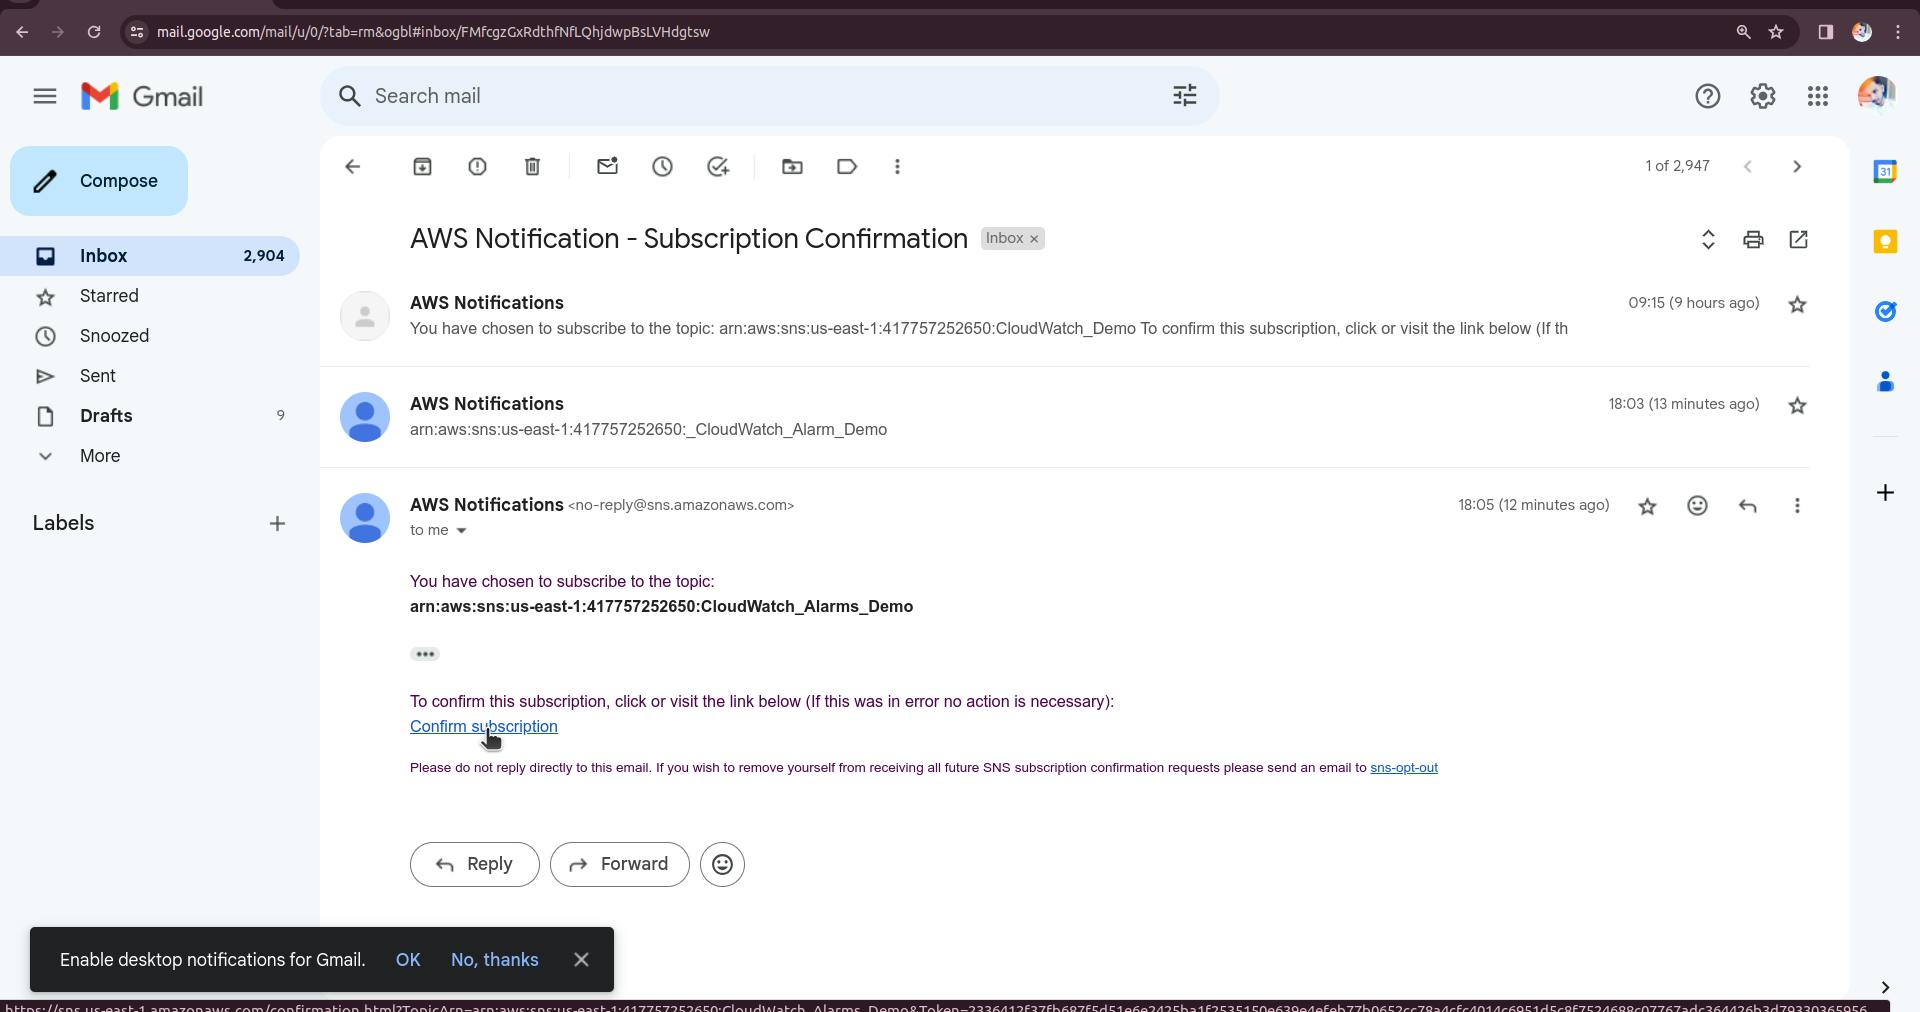
Don't click on 'Click here to unsubscribe.

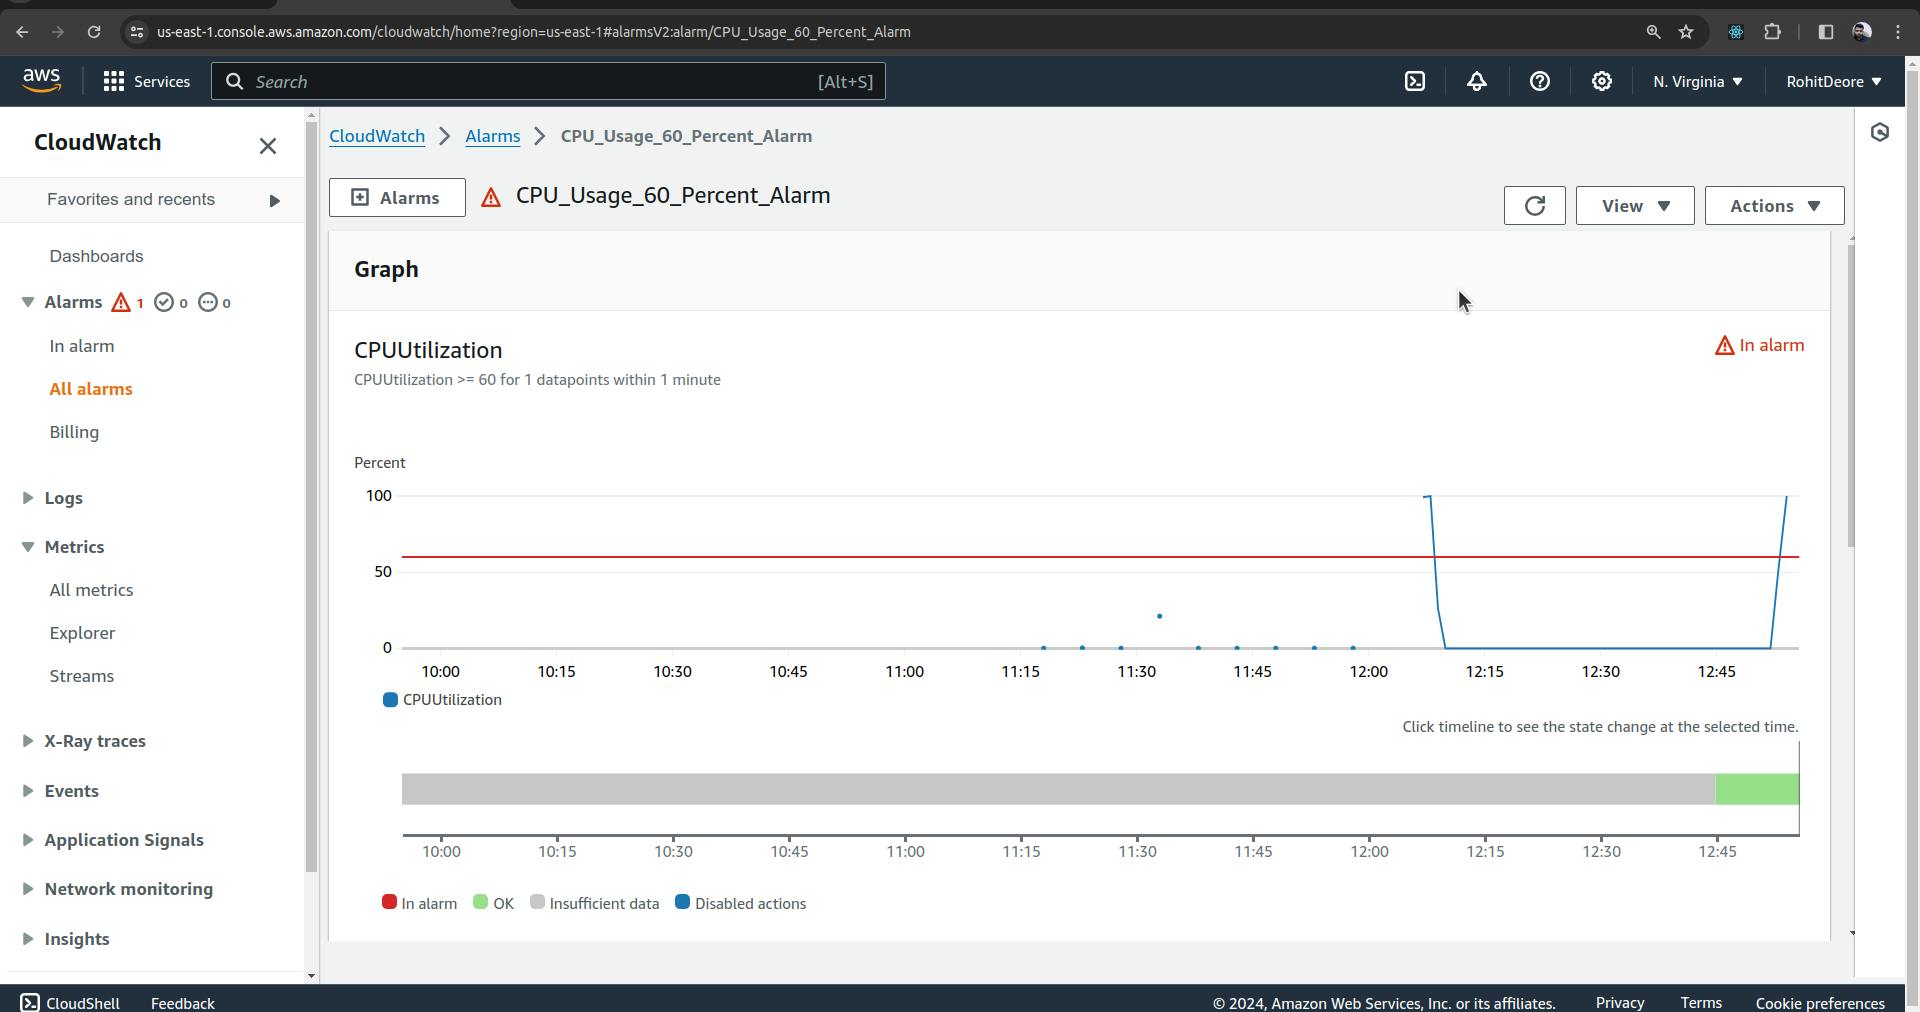
Now run the script again, and once the CPU usage reaches 60 percent, an email notification will be sent to the configured email address.
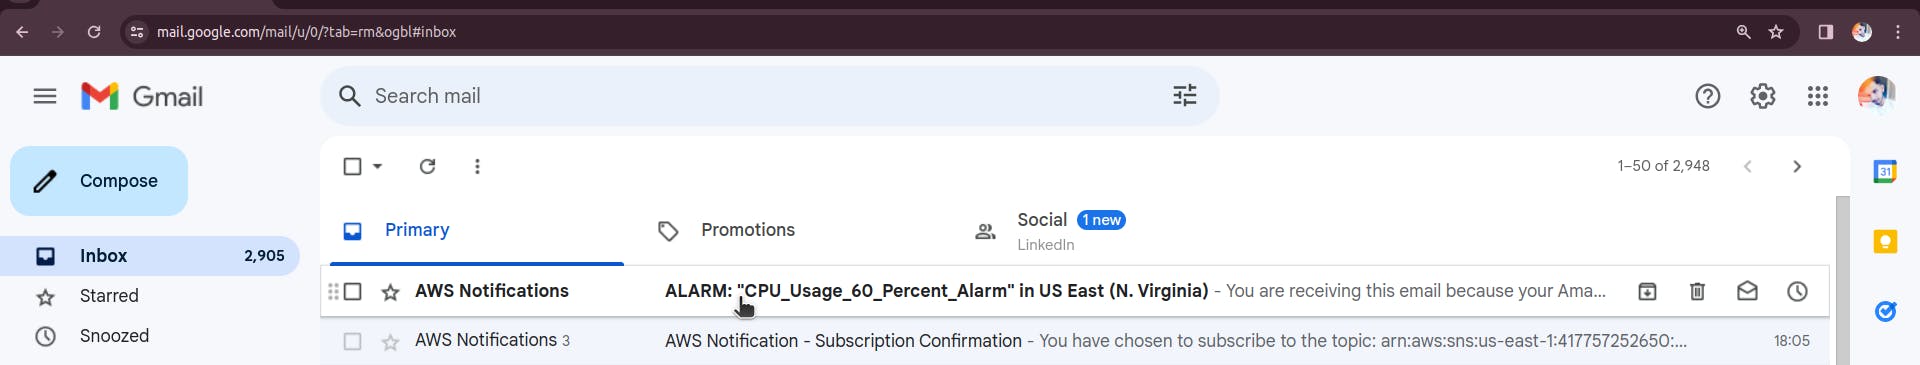
Check your email; you will receive an email notification

We have successfully completed the demo for CloudWatch.
Note: Please use the provided Python script for demo purposes only, and only on an EC2 instance. Do not attempt to run it on a personal computer.
On Closing
AWS CloudWatch is a powerful tool in the AWS ecosystem, designed to provide deep insights into the performance and operational health of your applications and services. By leveraging its comprehensive monitoring capabilities, you can ensure your applications run smoothly, identify issues before they affect your users, and optimize resource utilization. Despite its complexity and potential costs, the benefits of CloudWatch in maintaining system reliability and performance make it an essential tool for anyone running services in the AWS cloud. Dive into AWS CloudWatch, and unlock the full potential of cloud monitoring to keep your applications performing at their best.
Keep Exploring...